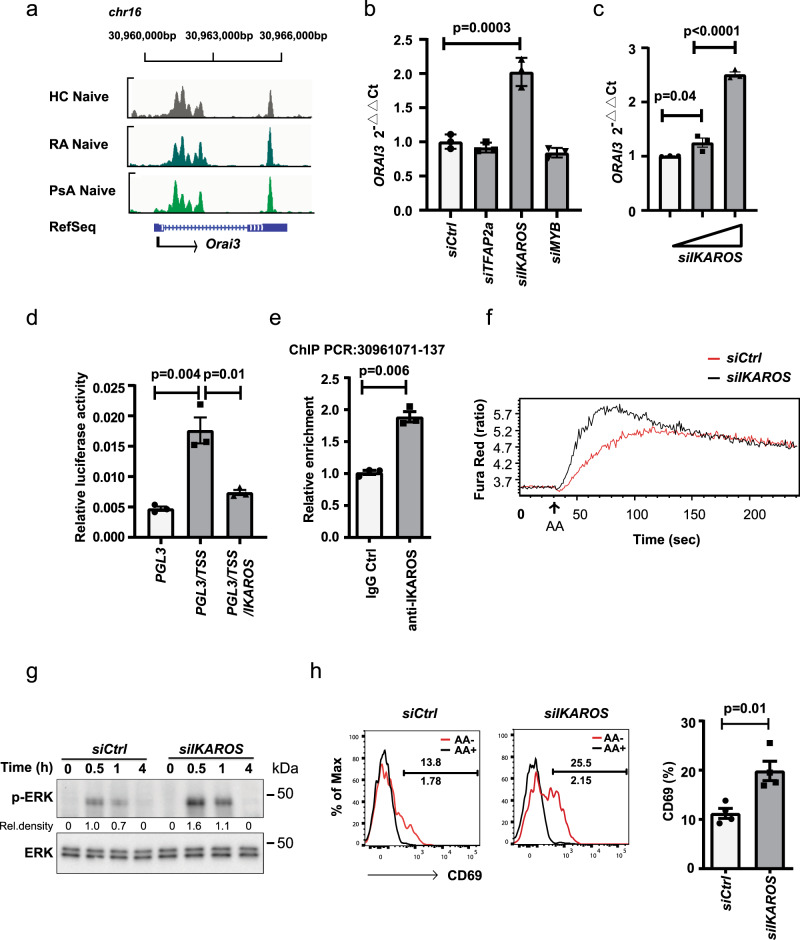
Fig. 7. Transcriptional control of ORAI3.
a Chromatin accessibility maps of naive CD4+ T cells from RA and PsA patients and from healthy individuals were generated by ATAC-seq. Accessible regions at ORAI3 TSS region (chr16:30,960,352–1215) and downstream of TSS (chr16:30,964,994–5367). b Accessible regions were analyzed for transcription factor (TF) motifs. Indicated TFs were silenced using siRNA transfected into HEK293T cells for 48 h, non-targeting siRNA was used as a negative control. ORAI3 transcripts were quantified by qPCR and normalized to β-actin. Data are presented as mean ± SEM from three independent experiments (n = 3). Knockdown efficiency is shown in Supplementary Fig. 6. c Purified CD4+ T cells were transfected with increasing concentrations of IKAROS siRNA smart pool for 48 h. ORAI3 transcription was analyzed by qPCR and normalized to β-actin. Results are triplicates from one of two independent experiments. Data are presented as mean ± SEM. d The sequence (860 bp) upstream of ORAI3 TSS was cloned into the PGL3-basic plasmid and transfected into HEK293T cells alone or with an IKAROS-expressing plasmid. Firefly luciferase activity relative to Renilla luciferase is shown. Data are presented as mean ± SEM from three independent experiments (n = 3). e ChIP assays of CD4+ T cells using anti-IKAROS antibodies and a primer set amplifying the indicated potential binding site. Data are presented as mean ± SEM from three independent experiments (n = 3). f Flow cytometry analysis of AA-induced Ca2+ influx in IKAROS siRNA smart pool- and control siRNA-transfected CD4+ naive T cells. Histograms are representative of two experiments. g Immunoblot analysis of AA-induced ERK phosphorylation in CD4+ naive T cells transfected with IKAROS siRNA smart pool; one of two experiments. Uncropped Western blots in Supplementary Fig. 10. h Flow cytometry analysis of AA-induced CD69 expression in purified naive CD4+ T cells transfected with IKAROS siRNA smart pool. Representative histograms and data from four experiments. Data in b, c were analyzed with one-way ANOVA followed by Tukey’s multiple comparison test with adjustment. Data in d, e, and h were analyzed with unpaired two-tailed Student’s t test. Source data are provided as a Source Data file.

