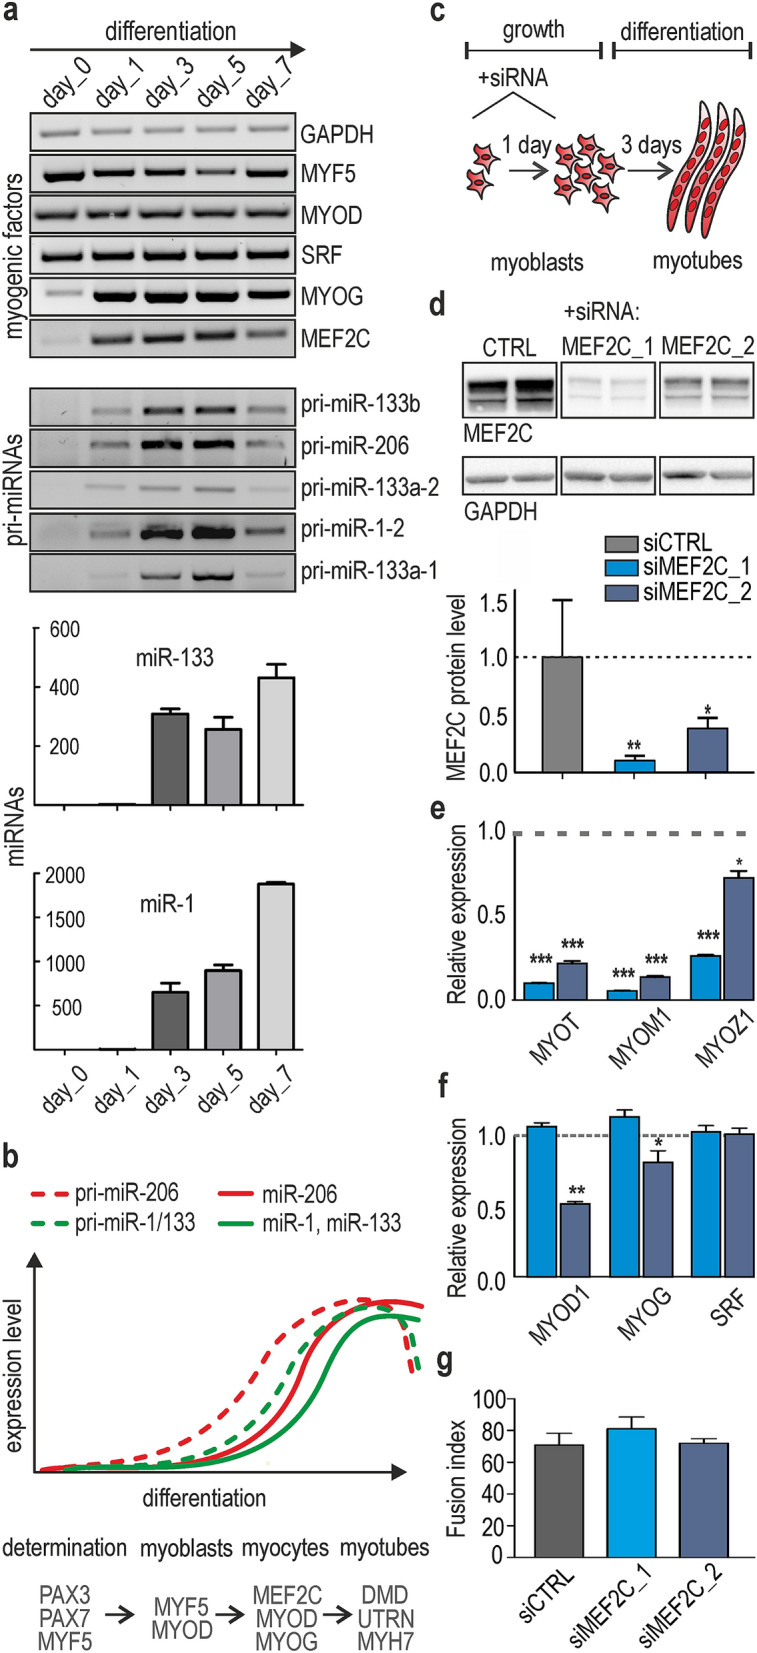
Figure 1.

The expression of muscle-specific miRNAs is correlated with MEF2C and MYOG level during skeletal muscle differentiation. (a) RT-PCR-based quantification of the level of miRNA, pri-miRNAs and mRNA of myogenic factors performed for primary human myoblasts in growth (day 0) or differentiation conditions (days 1, 3, 5 and 7). Image was created by using GeneTools 4.3.9.0 and CorelDRAW 2017. Fully uncut gel images are shown in Supplementary information, uncut images section; level of miR-1 and miR-133 was analyzed using TaqMan real-time PCR normalized to U6RNA. The three human primary myoblasts were tested. (b) Graph showing the pattern of temporal expression changes in selected pri-miRNA and their mature forms. Specific markers of different stages of muscle cells differentiation are shown above the graph. (c) Experimental timeline for the HSkM cell cultures. Proliferating HSkM cells were transfected with siCTRL, siMEF2C_1 or siMEF2C_2 (day 0) and then transferred to differentiation medium. The next day, the cells were transfected once again and cultured in differentiation medium for the next 3 days. (d) The steady state level of MEF2C protein (normalized to GAPDH) was strongly reduced during the course of the experiment. siMEF2C_1 induced more efficient reduction of MEF2C. The experiment was performed in HSkM cells in triplicates. Signals were quantified with GeneTools from Syngene (https://www.syngene.com/software/genetools-automatic-image-analysis/). Fully uncut gel images are shown in Supplementary information, uncut images section. (e) Three MEF2C-dependent target genes encoding muscle-specific proteins subsequently showed reduced expression on mRNA level. (f) The main markers of myogenesis (MYOD, MYOG and SRF) were not down-regulated in differentiated HSkM cells treated with siMEF2C_1; moderate decrease of MYOD and MYOG was observed in siMEF2C_2 KD experiments. The results in (e) and (f) are average results of RT-qPCR analyses performed for three independent samples from siMEF2C-treated (blue bars) and siCTRL-treated cells (gray bars) normalized to GAPDH. Standard deviation (SD) and statistical significance based on an unpaired Student’s t-test are shown (* P < 0.05, **P < 0.01, ***P < 0.0001). (g) Fusion index of HSkM was not changed in differentiated myoblasts treated with siMEF2C_1 or siMEF2C_2. The fusion index was calculated as the number of nuclei within myotubes expressed as a percentage of the total number of nuclei in the image frame. Calculations were performed for three independent samples from siMEF2C_1 or siMEF2C_2-treated (blue bars) and siCTRL-treated cells (gray bar).
