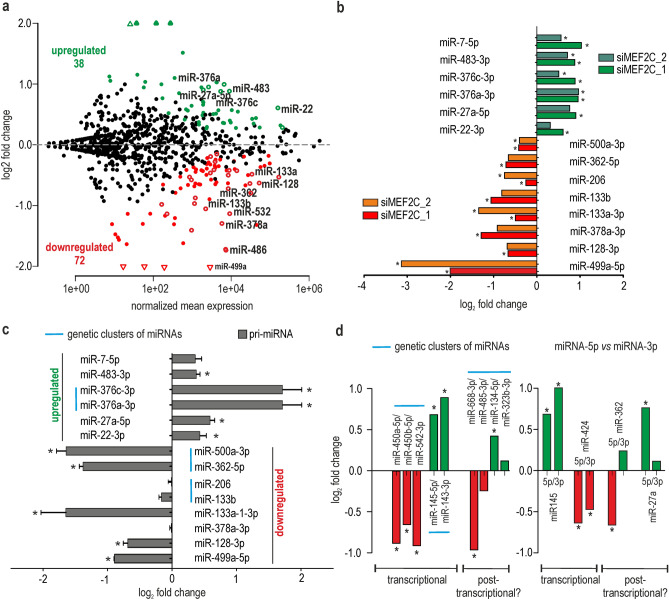
Figure 2.
Changes in the expression profile of miRNAs in human skeletal myocytes with MEF2C depletion. (a) MA-plot showing the prediction of differentially expressed miRNAs between cells treated with control and MEF2C-specific siRNAs. The red solid dots represent the statistically significant results for miRNAs downregulated in cells treated with siMEF2C_1; the green solid dots represent significantly upregulated miRNAs by siMEF2C_1. Empty dots represent miRNAs deregulated by both siMEF2Cs (_1 and_2). The experiment was performed in HSkM cells in triplicates. (b) Validation of the results from (a) in HSkM with MEF2C KD. The expression of 14 mature miRNAs was quantified using polyA-RT-qPCR analysis. The expression level of miRNAs were normalized to the level of the small nuclear U6RNA. Green/dark green and red/orange bars represent miRNAs predicted to be upregulated or downregulated according to RNA-seq after treatment with siMEF2C_1 or siMEF2C_2, respectively. The results are average values from three independent experiments + / − SD (* P < 0.05). (c) Relative expression changes of pri-miRNAs quantified by RT-qPCR assays divided into two groups (miRNAs predicted to be upregulated or downregulated according to RNA-seq results); all data for pri-miRNA were averages from three independent experiments + / − SD normalized to mRNA of GAPDH (* P < 0.05). MiRNAs from the same genetic cluster are marked with a blue line. (d) Expression changes of miRNAs coming from the same pre-miRNA hairpin or from the same genetic cluster (marked with blue lines) based on RNA-seq data. MiRNA candidates which could be regulated transcriptionally or posttranscriptionally are indicated.

