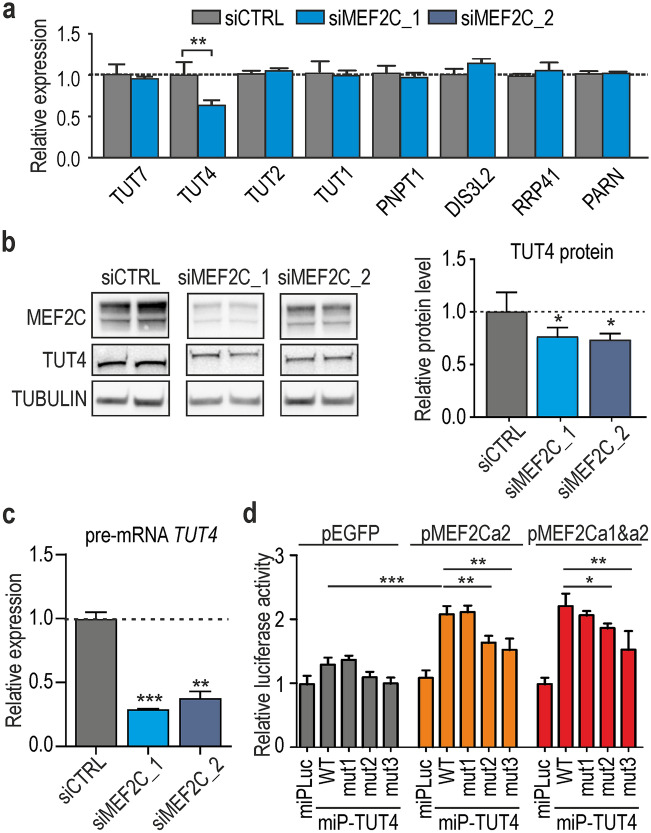
Figure 4.
MEF2C contributes to the 3′-uridylation of miRNAs via TUT4 activity. (a) Results of RT-qPCR for mRNAs encoding for TUTs and other proteins related to the turnover of miRNA (PNPT1, polyribonucleotide nucleotidyltransferase 1; RRP41, ribosomal RNA-processing protein 41; PARN poly(A)-specific ribonuclease). Each bar represents average from three independent biological replicats + / − SD normalized to GAPDH (**P < 0.01). (b) Reduction in the level of TUT4 protein in MEF2C KD conditions confirmed by western blotting. Quantification of TUT4 is depicted in the graph below and based on 3 independent experiments normalized to GAPDH (*P < 0.05). Signals were quantified with GeneTools from Syngene (https://www.syngene.com/software/genetools-automatic-image-analysis/). Fully uncut gel images are shown in Supplementary information, uncut images section. (c) RT-qPCR analysis of pre-mRNA of TUT4. The amplified region was located in intron 2 of TUT4. The results are averages from 3 independent experiments normalized to GAPDH mRNA (= / − SD). The P value was assessed by an unpaired t-test (**P < 0.01; ***P < 0.001). (d) Normalized luciferase activity calculated for HeLa cells cotransfected with genetic constructs expressing two isoforms of MEF2C (MEF2Ca1 and MEF2Ca2) or GFP and the LUC gene with either a control minimal promotor (miPLuc) or minimal promotor of LUC with upstream fragment of TUT4 gene (miPfTUT4) or minimal promotor of LUC with upstream fragment of TUT4 gene with mutations of putative MEF2C binding sites (miPmut1TUT4 or miPmut2TUT4 or miPmut1TUT4; see Table S8 for more details). Sequence of minimal promotor is depicted in Supplementary Table S2. The experiment was performed in 5 replicates, and the P value was assessed by an unpaired Student’s t-test (*P < 0.05; **P < 0.01).

