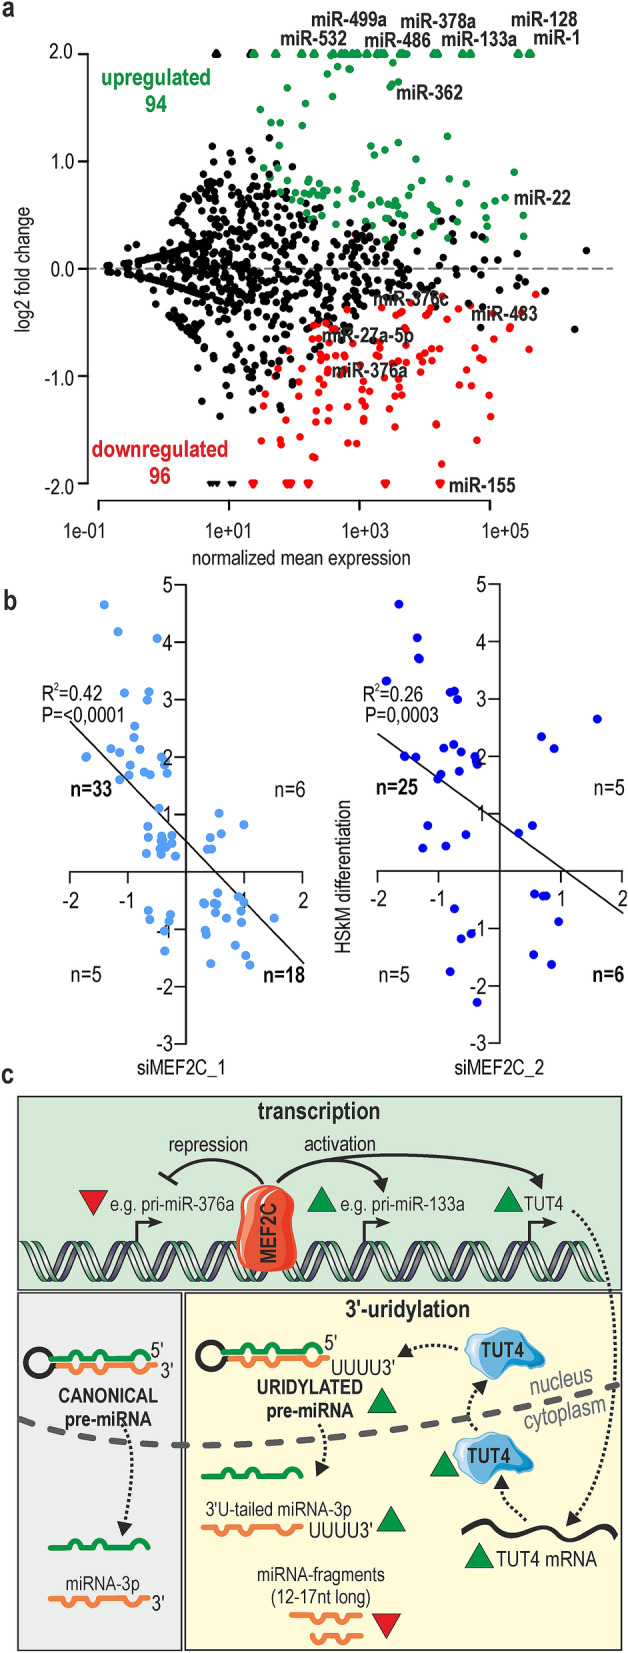
Figure 5.

Contribution of MEF2C to miRNA regulation in differentiated muscle cells. (a) MA-plot showing the prediction of differentially expressed miRNAs between proliferating HSkM cells and myotubes after 4 days of differentiation (n = 3 HSkM_0h and n = 3 HSkM_4d). The red dots represent the statistically significant results for miRNAs downregulated; the green dots represent significantly upregulated miRNAs (Padj < 0.05; a cutoff of a baseMean > 10). (b) Comparison of miRNA expression changes in two sets of experiments: MEF2C KD cells versus control treated cells (separately for siMEF2C_1 and siMEF2C_2) and 4 days differentiated muscle cells versus myoblasts (HSkM differentiation). Linear regression scatter plots of miRNAs log 2FC expression values were calculated by comparison of miRNAs significantly changed upon MEF2C KD (Padj < 0.05) and miRNA significantly changed upon HSkMs differentiation (Padj < 0.05). The statistical analysis for linear regression was done by using the GraphPad Prism 8.3.0 tool. (c) Schematic overview of MEF2C activity in muscle cells. MEF2C, as a transcription factor, can both activate (e.g., pri-miR-133a) and repress (e.g., pri-miR-376a) miRNA expression. Interaction of MEF2C within promoter of TUT4 leads to increase of TUT4 level and normal 3′-uridylation of pre-miRNAs and miRNAs. Proper dynamics of uridylation guarantee the correct turnover of short pre-miRNA fragments. Red triangles represent downregulation, and green triangles upregulation.
