Figure 3.
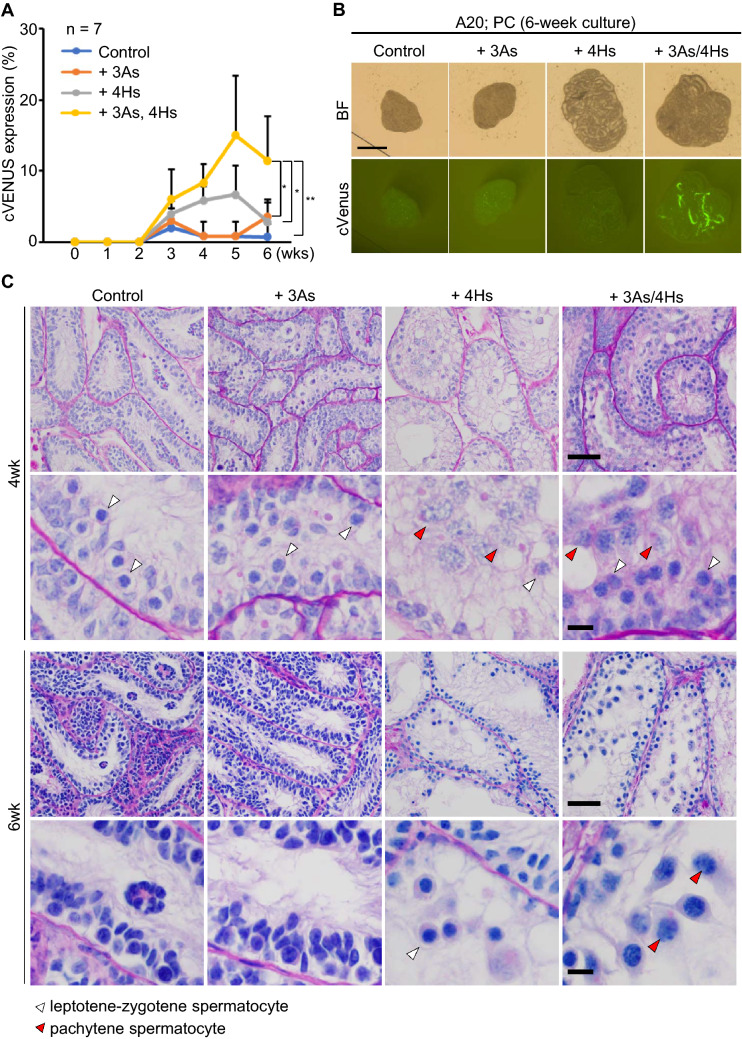
Antioxidants and hormones cooperatively promoted in vitro rat spermatogenesis. (A) The time course of cVenus expression area ratio of 4 groups was shown in a line graph. The culture medium of control group was αMEM + AlbuMAX (20 mg/mL). n = 7 (P4 and P7). Statistical significance; **P < 0.01. *P < 0.05. (B) Photos of cultured tissues at week 6. Scale bar; 1 mm. (C) PAS staining histological pictures of cultured tissues at 4 and 6 weeks. White and red arrowheads indicate leptotene/zygotene and pachytene spermatocytes, respectively. Magnified images are shown in 2nd and bottom row. Scale bar; 50 µm (top and 3rd row). Scale bar; 10 µm (2nd and bottom row).

