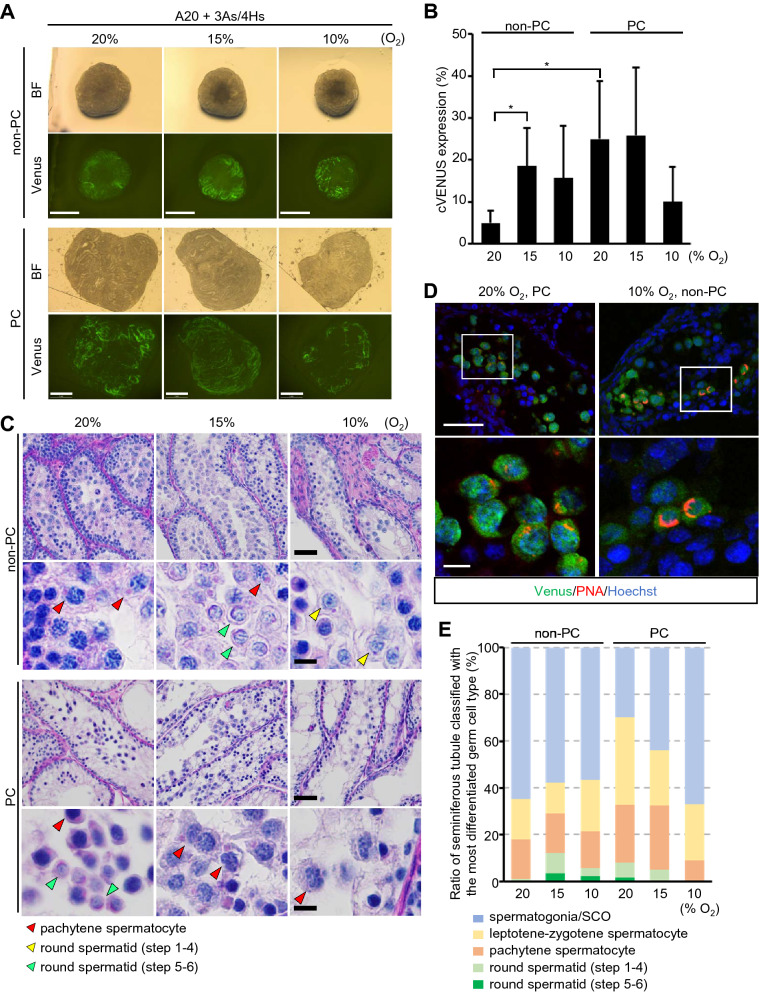
Figure 4.
Effect of oxygen concentration for in vitro rat spermatogenesis. (A) Photos of cultured testis tissues at week 6 in different O2 concentrations with or without PC. Scale bar; 1 mm. (B) cVenus expression area ratio in each group at week 6. n = 6–7 (P7). *P < 0.05. (C) Histological pictures of 6 week cultured tissue stained with PAS. Red, yellow, and green arrowheads indicate pachytene spermatocyte, round spermatids at step 1–4, and step 5–6, respectively. Panels in 2nd and bottom row are magnified image. Scale bar; 50 µm (top and 3rd row), 10 µm (2nd and bottom row). (D) Immunohistochemical staining with anti-Venus (green) and PNA (red), along with nuclear stain with Hoechst (blue). Area in white rectangles in top panels was enlarged in bottom panels. Scale bar; 50 µm (top panels), 10 µm (bottom panels). (E) Ratio of seminiferous tubules classified with the most differentiated germ cell type contained was shown by band graph. Round spermatids of step 1–4 appears as having acrosome of dot shape, while step 5–6 having cap shape. n = 5–12 (P7).

