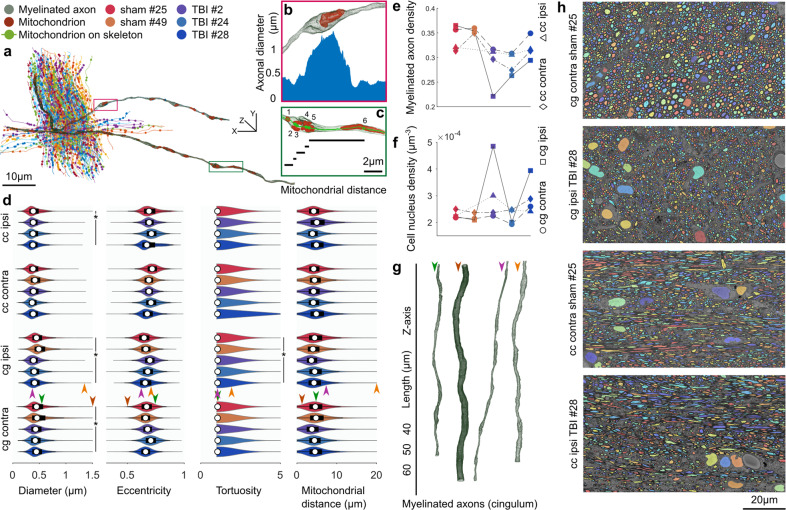
Fig. 5. White matter morphology analysis.
a A bundle of myelinated axons was sampled from the cingulum of the sham #25 dataset. Myelinated axons are represented by their curve skeletons. The centroids of mitochondria were projected on the axonal skeletons, shown as filled-circles. b A small section of a myelinated axon from a represents how the axonal diameter can vary substantially along its length. The increased axonal diameter can be related to the accumulation of mitochondria. The plot shows the axonal diameter along the magnified section of the myelinated axon. c A small section of a myelinated axon from a shows the measure of inter-mitochondrial distance. Five mitochondria are accumulated with distances less than 1 μm, and one mitochondrion is distant from others with over 5 μm distance. d DeepACSON quantified the axonal diameter, eccentricity, and tortuosity of about 288 000 myelinated axons and the inter-mitochondrial distance of about 1 800 000 mitochondria. On each bean plot, the central mark indicates the median, and the left and right edges of the box indicate the 25th and 75th percentiles, respectively. The whiskers extend to the most extreme data points not considered outliers. The colors correspond with the animal ID. e The comparison of the density of myelinated axons, as the ratio of the volume of myelinated axons to the myelin volume plus the volume of myelinated axons. The color of the indicators corresponds with the animal ID. f The comparison of the density of cells, as the number of cell nuclei over the dataset volume. The color of the indicators corresponds with the animal ID. DeepACSON segmented about 2 600 cell nuclei in the ten large field-of-view datasets. g 3D rendering of myelinated axons from the cingulum visualizes the normative and outliers of the axonal diameter distribution. Each myelinated axon is given an arrowhead to mark its measurements in panel d. h Representative images of the cingulum and corpus callosum in sham-operated and TBI rats visualize the smaller density of myelinated axons caused by the injury.

