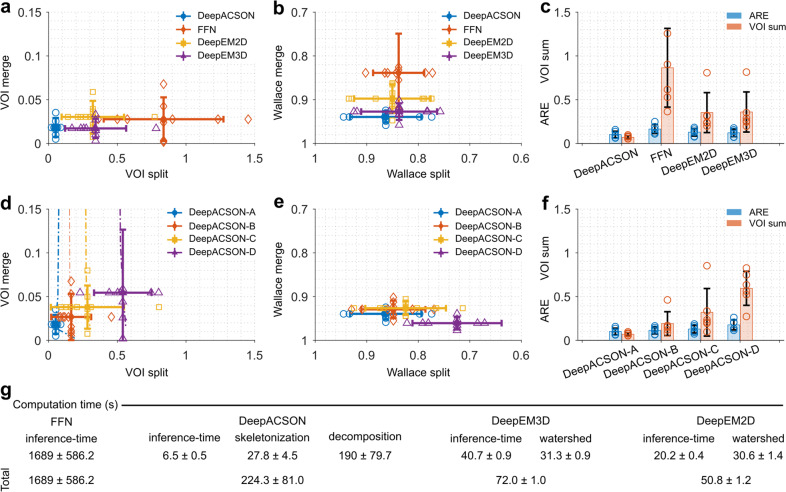
Fig. 6. DeepACSON quantitative evaluations.
Comparison of DeepACSON against state-of-the-art segmentation methods, DeepEM2D, DeepEM3D, and FFN, using a variation of information (VOI, split and merge contribution, lower value is better), b Wallace indices (split and merge contribution, higher value is better), and c adapted Rand error (ARE, lower value is better) and the sum of VOI split and VOI merge (VOI sum, lower value is better). DeepACSON outperformed other techniques as it produced the smallest VOI split, VOI merge, VOI sum, and ARE, and the biggest Wallace split and merge values. Comparison of the design parameters of DeepACSON: standard DeepACSON (DeepACSON-A), a U-Net with residual modules (DeepACSON-B), the effect of BM4D denoising (DeepACSON-C), and adjusting the resolution between the training and test sets (DeepACSON-D) over d VOI (split and merge contribution) e Wallace indices (split and merge contribution), and f ARE and VOI sum. The filled-circles and error bars show the mean and standard deviation of the evaluations, respectively. The dash-dotted lines show the choice of binarization threshold. The comparisons were run over the best threshold, i.e., smallest VOI merge and VOI split. g Comparison of the computation time of DeepACSON against DeepEM2D/3D and FFN (mean ± standard deviation). All comparisons were run over six test SBEM datasets of size 290 × 290 × 285 voxel3, automatically segmented using the ACSON pipeline5.

