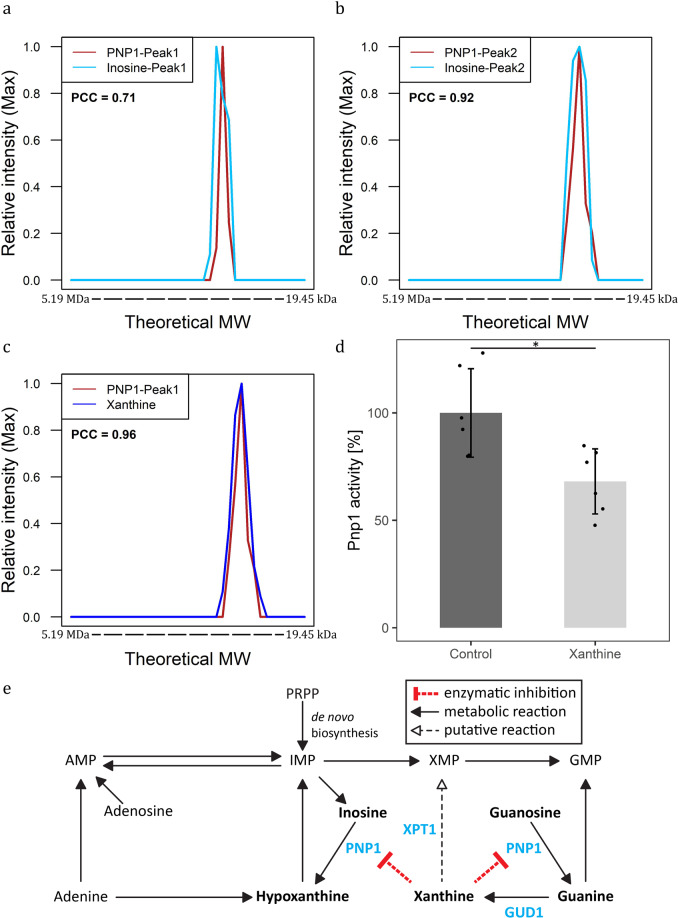
Fig. 3. Functional validation of the Pnp1–xanthine interaction.
a–c Elution profiles of Pnp1, with its known substrate inosine (a,b) and putative ligand xanthine (c) (Supplementary Data S6 and S7). The intensity was calculated relative to the maximum intensity of the molecule measured across size exclusion chromatography fractions. The theoretical molecular weight (MW) was calculated using reference proteins. d Xanthine inhibits Pnp1 activity. Total activity of recombinant Pnp1 in the presence of 100 µM xanthine was measured using an liquid chromatography-mass spectrometry-based assay (Supplementary Data S18). Inhibition was calculated in relation to Pnp1 activity in the absence of xanthine. Data represent the means ± SD, n = 6 independent samples. Asterisks denote significant difference (non-paired, two-tailed t test P value < 0.05). e Scheme of purine degradation pathway with predicted regulatory interaction between Pnp1 and xanthine. Molecules discussed in this study are depicted in bold. Enzymes are additionally marked in blue.

