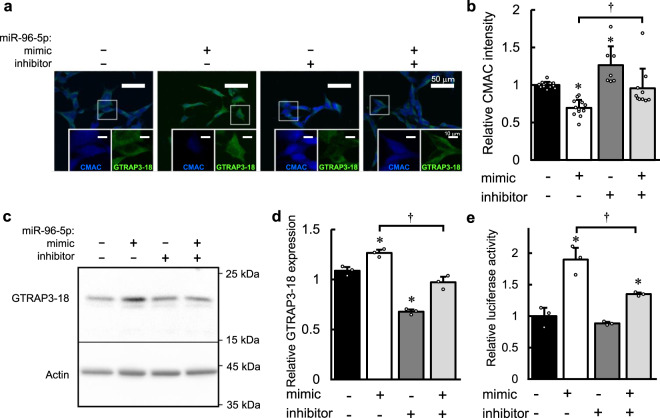
Fig. 1. The effect of miR-96-5p on GSH level and GTRAP3-18 expression.
a Confocal images show the effect of the miR-96-5p mimic and/or inhibitor transfection on the intensity of CMAC as a marker of GSH (blue) and the expression of GTRAP3-18 (green). Scale bar, 50 μm. Insets in panels are enlarged images corresponding to the box highlighted on the full images. Scale bar, 10 μm. b Quantification of the relative CMAC density in a is shown. Data are mean values ± SD obtained from independent samples and individual data points are plotted (n = 12 for negative control or miR-96-5p mimic, n = 7 for miR-96-5p inhibitor and n = 10 for both miR-96-5p mimic and inhibitor transfection). Data were analyzed by one-way ANOVA (F(3,37) = 14.345, p = 0.0000023) and Tukey’s HSD test. *p < 0.05 relative to the negative control. †p < 0.05 versus the effect of the miR-96-5p inhibitor. c The endogenous expressions of GTRAP3-18 and β-actin in Neuro2a cells with transfection of miR-96-5p mimic and/or inhibitor are shown. Molecular weight markers are depicted at right. Full blots are presented in Supplementary Fig. 12. d Quantification of the data in panel c by densitometry. Data represent mean values ± SD obtained from three independent experiments and individual data points are plotted. Data were analyzed by one-way ANOVA (F(3,8)=79.74, p = 0.0000027) and Tukey’s HSD test. *p < 0.05 relative to the negative control. †p < 0.05 versus the effect of the miR-96-5p inhibitor. e Relative luciferase activity in SH-SY5Y cells transfected with the luciferase plasmid of GTRAP3-18 3′-UTR with the miR-96-5p mimic and/or inhibitor is shown. Data represent mean values ± SD obtained from three individual experiments and individual data points are plotted. Data were analyzed by one-way ANOVA(F(3,8) = 31.27, p = 0.000091) and Tukey’s HSD test. *p < 0.05 relative to the negative control. †p < 0.05 versus the effect of the miR-96-5p inhibitor.

