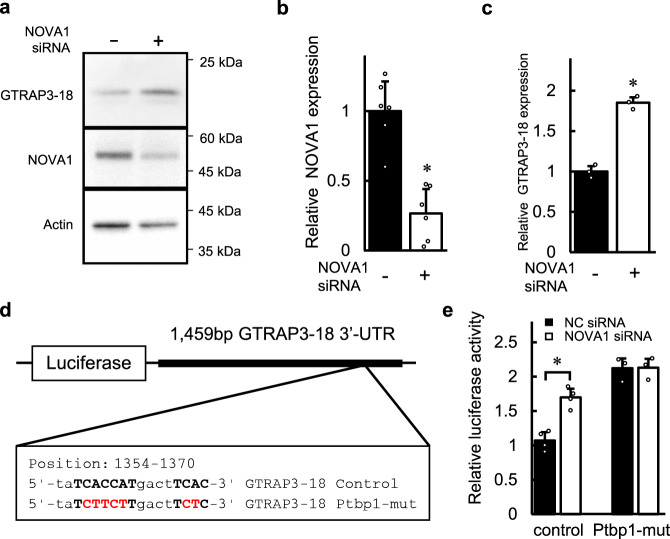
Fig. 4. The effect of NOVA1 knockdown on the expression of GTRAP3-18.
a The endogenous expressions of GTRAP3-18, NOVA1 and β-actin after transfection of NOVA1 siRNA (+) or negative control siRNA (−) are shown. Molecular weight markers are depicted at right. Full blots are presented in Supplementary Fig. 15. b Densitometric quantification of the NOVA1 expression in a is shown. Data represent mean values ± SD obtained from six individual experiments and individual data points are plotted. Data were analyzed Student’s t-test, two-sided. *p < 0.05 relative to the negative control. c Densitometric quantification of the GTRAP3-18 expression in a is shown. Data represent mean values ± SD obtained from three individual experiments and individual data points are plotted. Data were analyzed by Student’s t-test, two-sided. *p < 0.05 relative to the negative control. d A schematic plot of the luciferase constructs of GTRAP3-18 3′-UTR is shown. The sequence for the predicted NOVA1-binding site is shown in the box. Mutation was added in a core sequence (red font) of tandem YCAY clusters (bold font). The mutated sequence contains a predicted binding site of Ptbp1 (Ptbp1-mut). e Relative luciferase activities in SH-SY5Y cells transfected with the luciferase plasmids in d with the NOVA1 siRNA or negative control (NC) are shown. Data represent mean values ± SD obtained from independent samples (n = 4 for control, n = 3 for Ptbp1-mut) and individual data points are plotted. Data were analyzed by Student’s t-test, two-sided. *p < 0.05 relative to the negative control.

