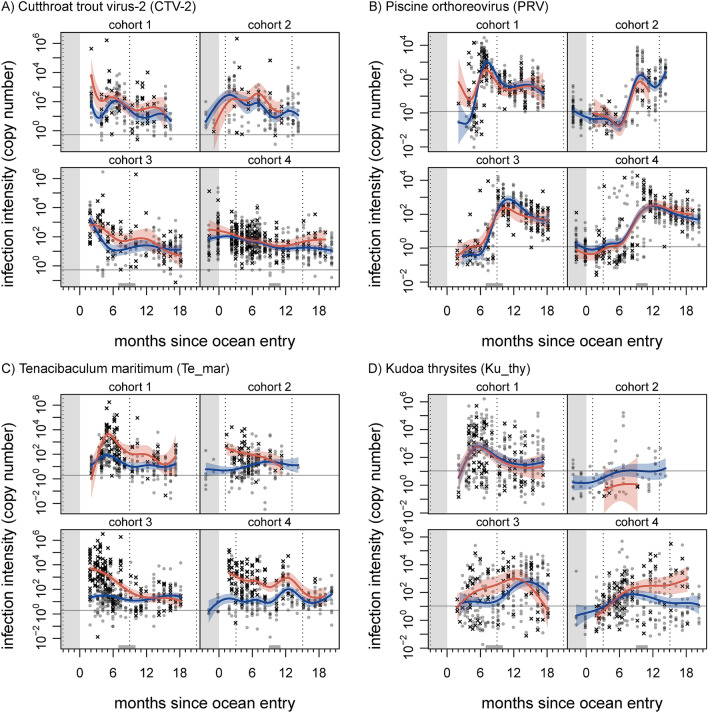
Figure 3.
Agent intensity of Cutthroat trout virus (CTV-2; A), Piscine orthoreovirus (PRV; B), Tenacibaculum maritimum (Te_mar; C), and Kudoa thyrsites (Ku_thy; D) in farmed Atlantic salmon throughout four production cycles. Grey circles represent live fish, and black X’s represent dead/dying fish. Curves indicate mean predictions from a generalised additive model; blue and red correspond to live and dead/dying fish, respectively (shaded areas show 95% confidence regions). Left-hand grey region indicates freshwater hatchery residence, grey regions on x-axis indicate period of transfer to another site, and vertical dotted lines correspond to January 1st. Horizontal grey line indicates limit of detection (yielding ≈90% true positive rate) for respective qPCR assay run in duplicate. Note log scale.

