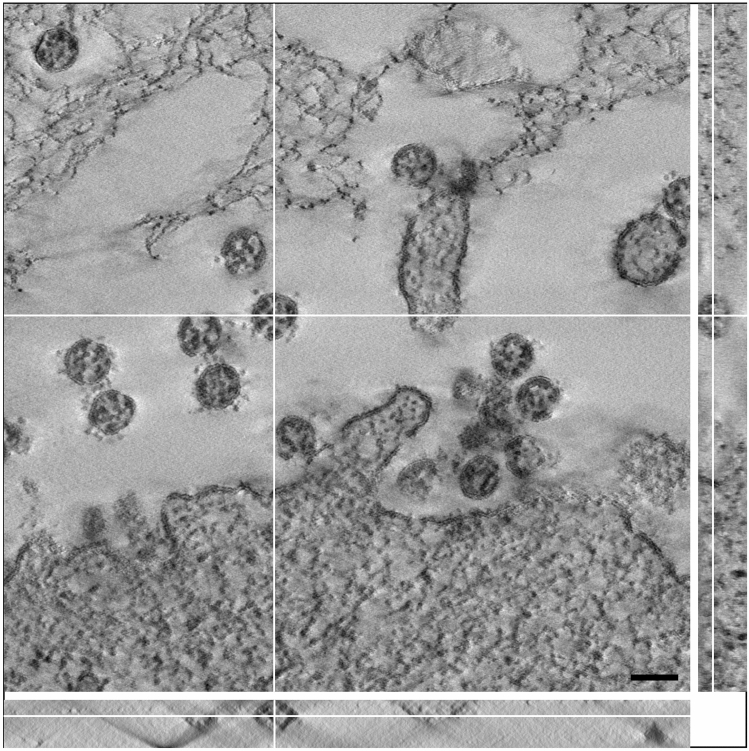
Figure 4.
A single digital slice (z view) of an electron tomogram of SARS-CoV-2 particles. The ortho-slice view shows the particle labelled by the white cross lines in side view (x/z and y/z) of the volume at the indicated section plane. The particle appears ovoid in shape and the thickest part of the particle in z was selected for size measurement. Note that the section is compressed in z and thinner than the nominal 180 nm set at the microtome, which also affects the shape of the particle viewed in x/z and y/z. This artifact is well known in electron tomography of plastic sections and only slightly affects the size in x/y23 which our shrinkage measurements demonstrated (see Results). Scale bar = 100 nm.

