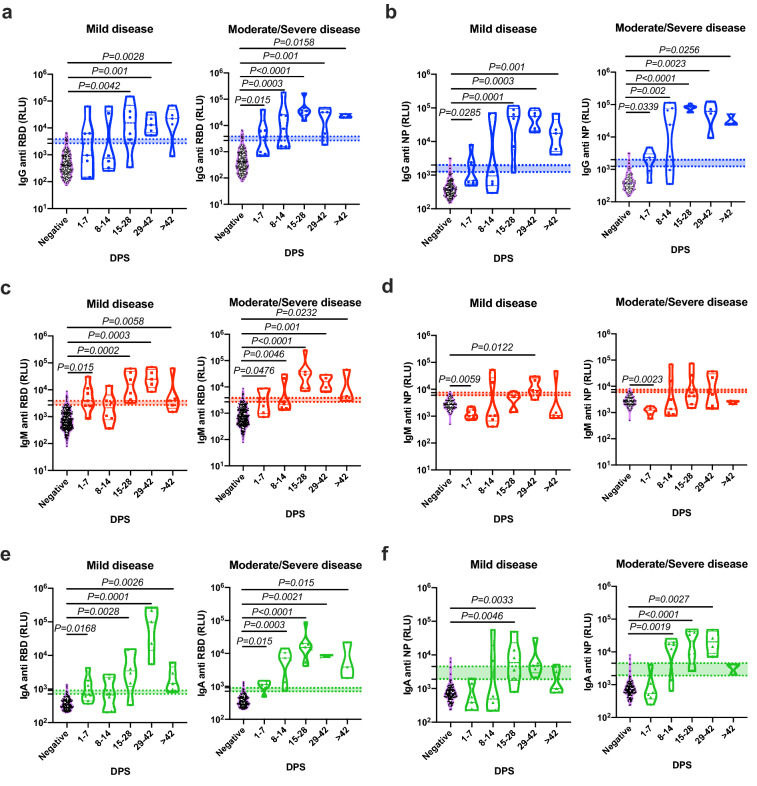
Figure 3.
Correlation of the antibodies’ response to the disease severity. Peripheral blood was collected from hospitalized COVID-19 patients. Negative samples were obtained from true SARS-CoV-2 negative patients (i.e., prior to the SARS-CoV-2 pandemic). Plasma was obtained, diluted 1:50, and added to a 96-well plate precoated with SARS-CoV-2 RBD (a,c,e) or NP (b,d,f) antigens. Patients’ antibody results were grouped according to their disease severity and graphed against DPS. Data were calculated using GraphPad Prism 8; the dotted line represents the calculated cutoff values (95% and 98% sensitivity) discriminating between positive and negative samples. Statistical analysis was performed using a Nonparametric Kruskal–Wells test for multiple comparisons against negative samples. Significant P values are shown.

