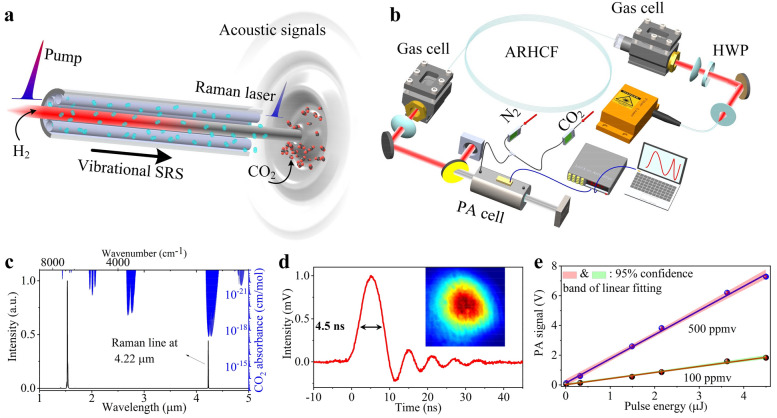
Figure 1.
Principle and schematic of the MIR PA CO2 monitoring. (a) Concept of the PA system integrated with an H2-filled ARHCF based MIR Raman laser. (b) Experimental setup, primarily consisting of a pump laser, H2-filled ARHCF, PA cell, a power meter to record the optical power of the laser, a LIA and a dynamic N2/CO2 gas-flow configuration. (c) The spectrum of the pump and generated laser overlaid on top of the simulated absorbance spectrum of CO2. The right axis shows the simulated absorbance spectrum of CO2. (d) Pulse profile of the Raman laser; Inset is the measured beam profile in the MIR. (e) Measured PA intensity as a function of the laser pulse energy at two different CO2 concentrations (500 ppmv and 100 ppmv). Shaded regions correspond to the 95% confidence band for every case.

