FIGURE 7.
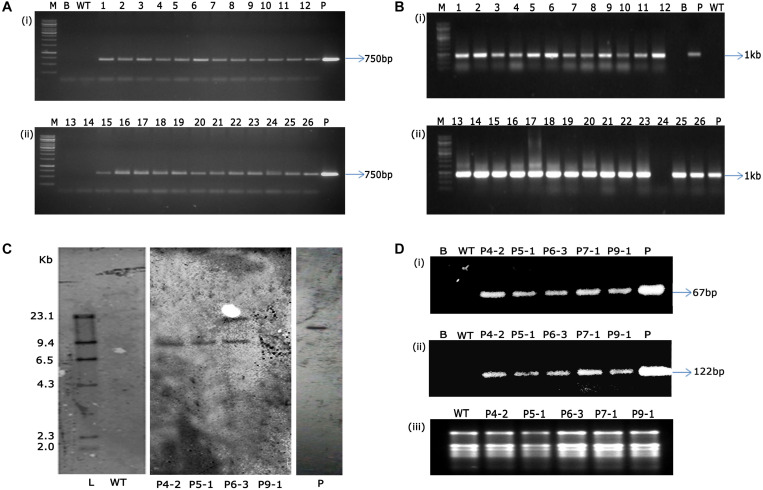
PCR analysis of T1 transgenic plants and wild type plants showing amplification of 750 bp nptII gene (A) and 1 kb GUS gene (B) [Lane M: 1 kb marker (Thermo scientific), Lane B: water blank (all PCR components except template DNA), Lane WT: wild type plant, Lanes 1-26: putative T1 transgenic plants obtained after kanamycin screening, Lane P: binary vector pCambia2301 as positive control], (C) genomic Southern analysis of transgenic plants probed with DIG-labeled 750 bp nptII gene fragment, Lane L: Lambda HindIII DNA digest, Lane WT: wild type, Lanes 1–4: transgenic plants (P4-2, P5-1, P6-3, P9-1, respectively), Lane P: linearized plasmid of pCambia 2301, (D) sqRT-PCR analysis for the assessment of transcript accumulation of (i) nptII, (ii) GUS genes, and (iii) total RNA as loading control. [Lane B: water blank (all PCR components except template DNA), Lane WT: wild type plant, and transgenic plants P4-2, P5-1, P6-3, P7-1, P9-1, Lane P: binary vector pCambia2301 as positive control].

