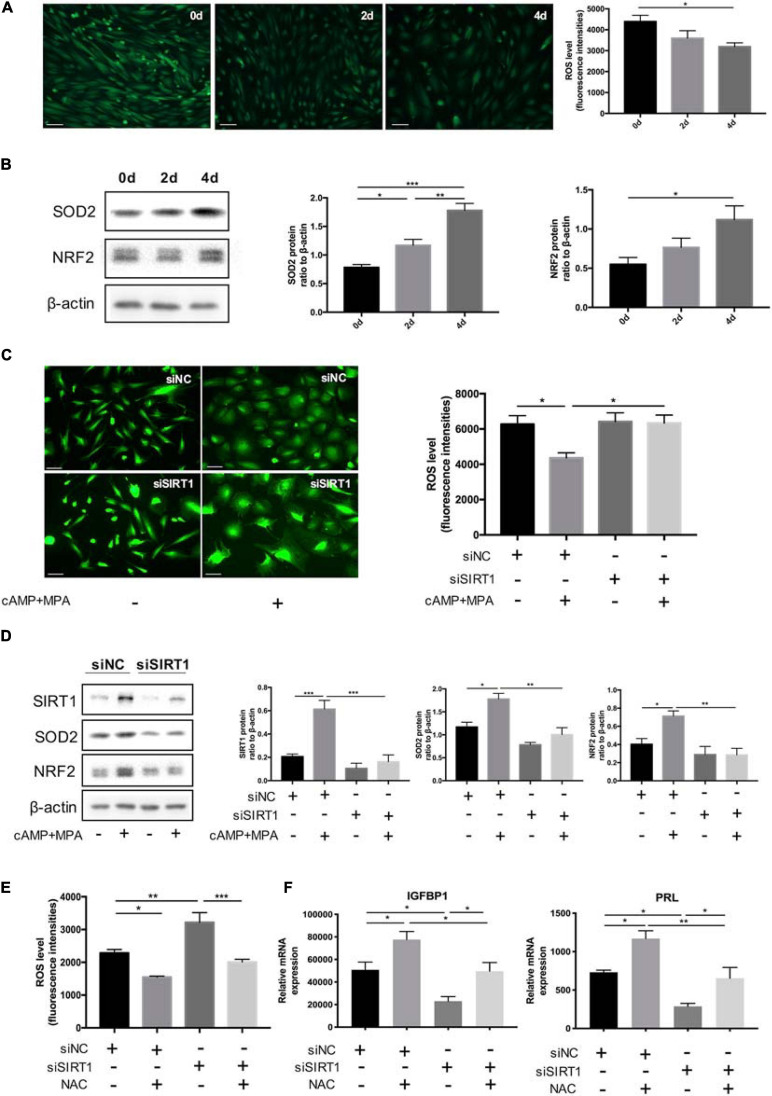
FIGURE 4.
The effect of SIRT1 on ROS homeostasis in ESC decidualization. (A) The change of ROS abundance during decidualization in vitro (0, 2, and 4 days). ROS levels were measured by the DCFH-DA fluorescence intensities (green). Scale bar is 100 μm. Images was representative and bar graph was the average data of three independent experiments. (B) Western blotting analysis of SIRT1, SOD2, and NRF2 protein abundance in decidualization ESC (0, 2, and 4 days). Blots graph was representative and bar graphs were the average data of four independent experiment. (C) Quantification of fluorescence intensities of ROS levels between siNC and siSIRT1 groups with and without inducing decidualization treatment. Images were representative and bar graph was the average data of three independent experiments. Scale bar is 50 μm. (D) Western blotting analysis of FOXO1, SOD2, and NRF2 protein abundance in siNC, siSIRT1 groups. Blots graph was representative and bar graph was the average data of four independent experiments. (E) Quantification of fluorescence intensities of ROS levels after NAC treatment between siNC and siSIRT1 groups. Bar graph was the average data of three independent experiment. (F) The mRNA levels of decidual biomarkers with or without NAC treatment in siNC, siSIRT1 groups. mRNA expression levels were normalized to β-actin. Bar graph was the average data of five independent experiment. *P < 0.05, **P < 0.01, and ***P < 0.001 (data are means ± SEM).

