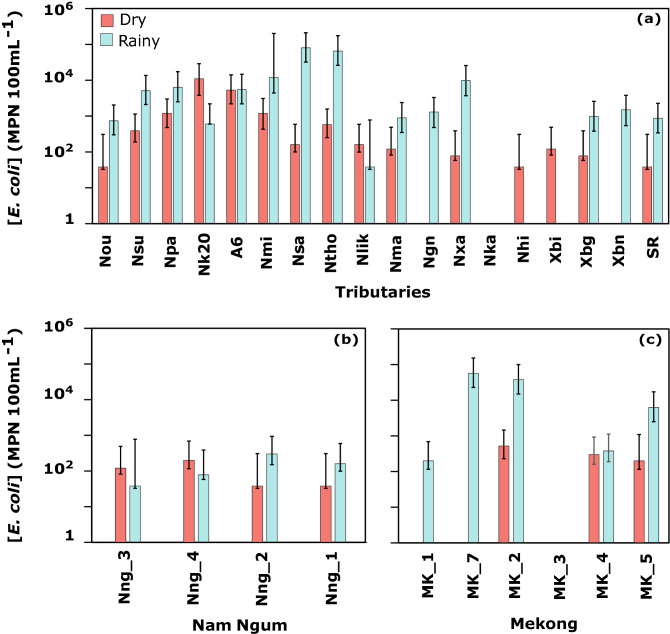
Figure 2.
E. coli concentration with lower and upper 95% confidence limits ([E. coli], MPN 100 mL−1) in sampled watersheds of (a) Mekong tributaries, (b) Nam Ngum river, and (c) Mekong river across Lao PDR. Bars filled with orange represent concentrations during March 2016 (dry season) and bars filled with blue represent concentrations during July 2016 (rainy season). Sampling stations are classified from northern to southern Lao PDR. Figures generated with RStudio (version 1.2.1335; http://www.r-project.org) and edited with Inkscape (version 0.92.4; https://inkscape.org).

