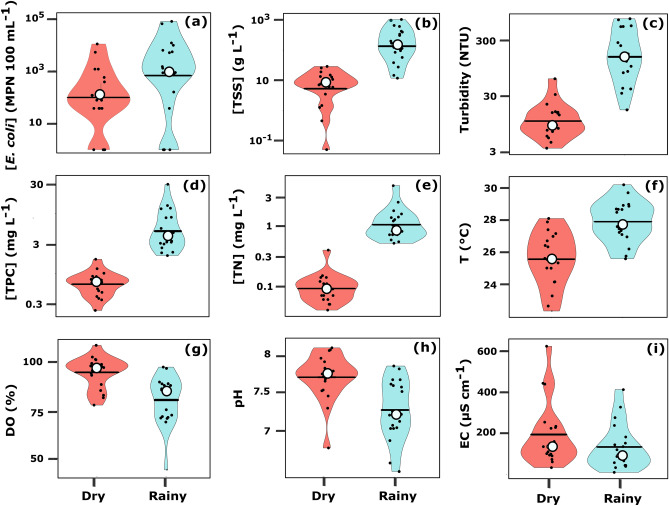
Figure 3.
Violin plots of measured variables across sampling sites in Mekong tributaries of Lao PDR in March 2016 (dry season) and in July 2016 (rainy season): (a) E. coli concentrations ([E. coli], MPN 100 mL−1); (b) total suspended sediment concentrations ([TSS], g L−1); (c) turbidity (NTU); (d) total nitrogen concentration ([TN], mg L−1); (e) total particulate carbon concentration ([TPC], mg L−1); (f) temperature (T, °C); (g) dissolved oxygen saturation (DO, %); (h) pH; (i) electrical conductivity (EC, µS cm−1). Black circle represents the mean, the black line is the median, and black dots are the variable observations. Figures generated with RStudio (version 1.2.1335; http://www.r-project.org) and edited with Inkscape (version 0.92.4; https://inkscape.org).

