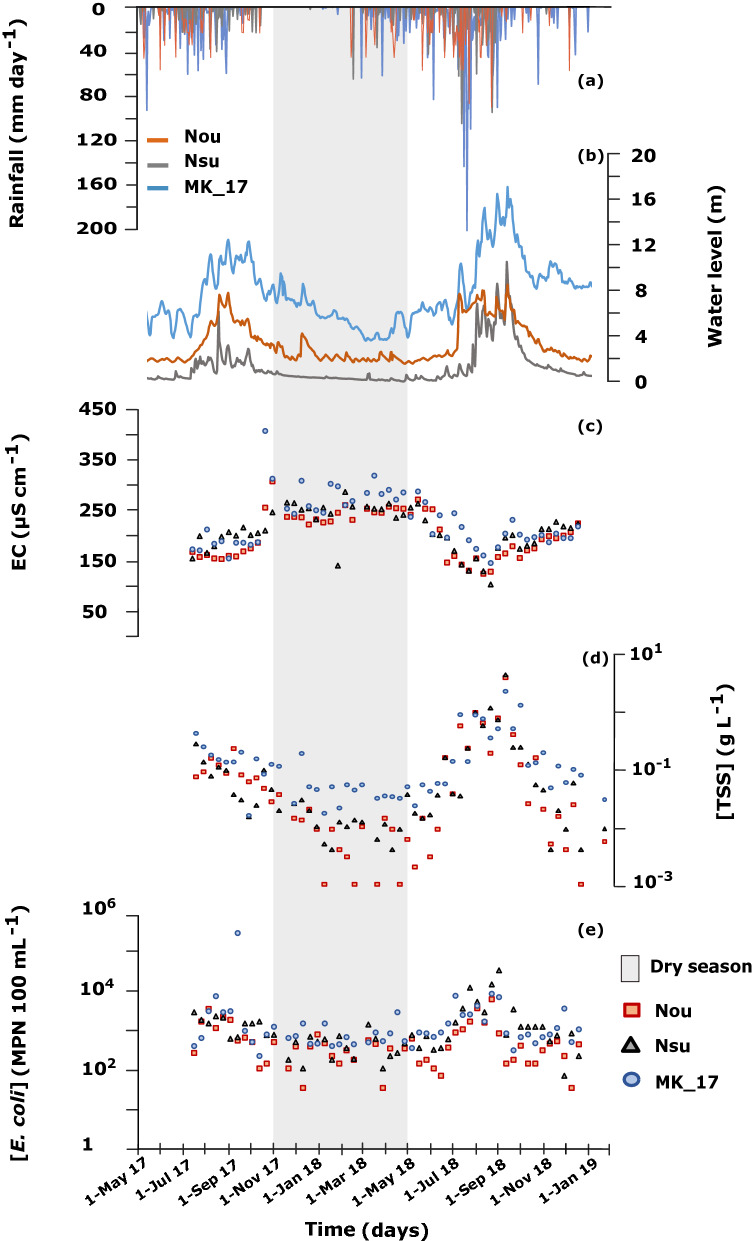
Figure 6.
2017–2018 time series of variables measured at the outlet of three watersheds in northern Lao PDR, Nam Ou (Nou), Nam Suang (Nsu), and Mekong (MK_17): (a) daily rainfall (mm day−1) taken from meteorological stations of the Department of Natural Resources and Environment of Luang Prabang; (b) daily water level (m); (c) electrical conductivity (EC, µS cm−1); (d) total suspended sediment concentration ([TSS], g L−1); (e) E. coli concentration ([E. coli], MPN 100 mL−1). The highlighted area in grey represents the dry season (November–May). Figures generated with RStudio (version 1.2.1335; http://www.r-project.org) and edited with Inkscape (version 0.92.4; https://inkscape.org).

