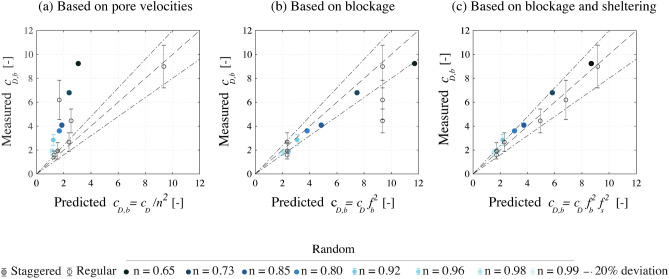
Figure 3.
Predictions of the analytical model versus measurements for random cylinder arrays with varying porosities, by Tinoco and Cowen22 and Tanino and Nepf21, and versus measurements for regular and staggered arrangements by Jansen29. Plot (a) shows the bulk drag coefficient calculated from the pore velocities (based on mass conservation over the fluid volume). Plot (b) shows the drag values derived from blockage factor (based on mass conservation over a cross-section). Plot (c) shows the results of the present model, which includes both blockage and sheltering effects. The vertical bars show the estimated measurement error.

