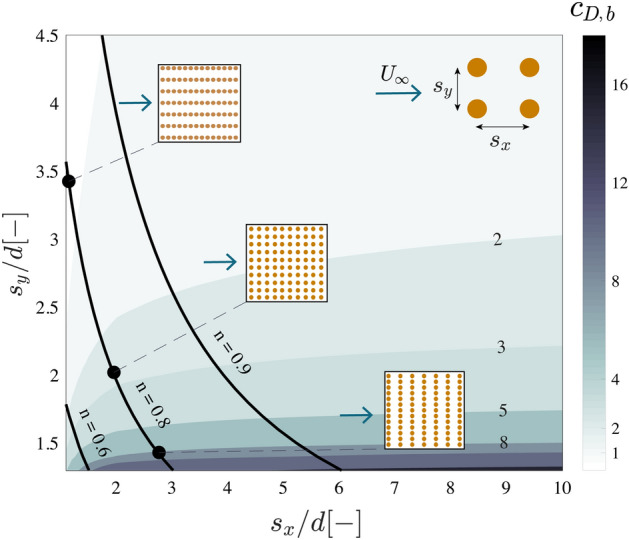
Figure 6.

Predicted bulk drag coefficient as a function of the streamwise spacing and spanwise spacing between cylinders compared to the cylinder diameter, d. The diagram shows lines of constant volumetric porosity n. Three examples of regularly spaced configurations with constant porosity of but varying streamwise/spanwise spacing are given. Flow direction relative to the arrays is indicated by a blue arrow (from left to right). The diagram shows that given a constant porosity, higher drag values can be obtained for smaller spanwise spacings and longer streamwise spacings .
