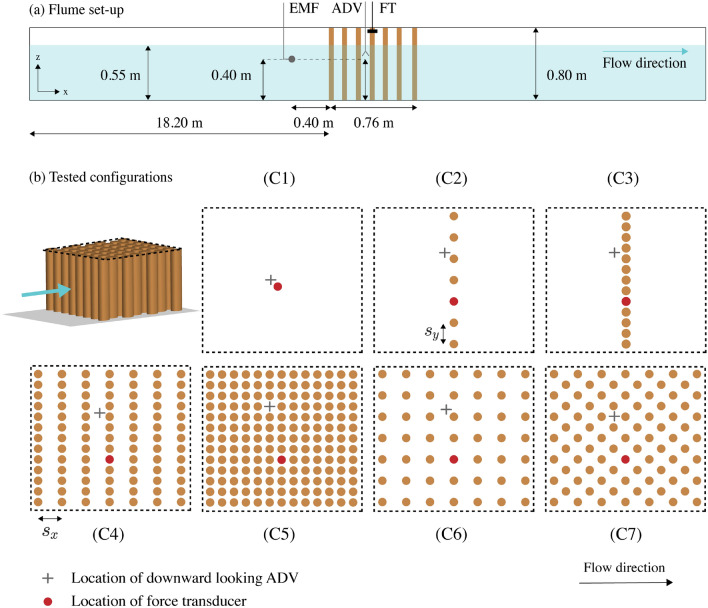
Figure 7.
(a) Side view of the instrument set-up in the flume, consisting of an electromagnetic flow meter (EMF), a Nortek Vectrino acoustic velocimeter (ADV) and a SCAIME load cell mounted on the upper part of the element (FT). (b) Configurations tested in the experiments. An oblique view of the structure is shown at the top left side of the plot, where the flow direction is indicated by a blue arrow. The top view of the structure is marked by a dashed black line, and it is illustrated for each of the tested arrangements: (C1) single cylinder with 0.04 m, (C2) single row with spanwise spacing between the elements of , (C3) single row with spanwise spacing between the elements of , (C4) multiple rows with and in uniform arrangement, (C5) multiple rows with and in uniform arrangement, (C6) multiple rows with and in uniform arrangement, and (C7) multiple rows with and in staggered arrangement.

