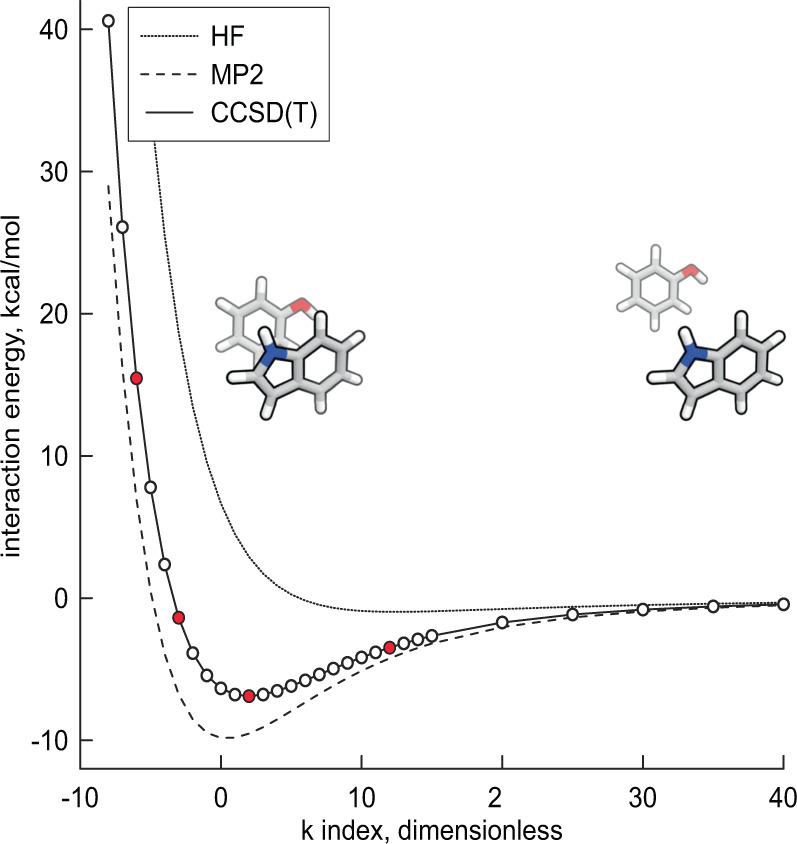
Fig. 3.

Typical dimer interaction energy profile, showing HF (at aVQZ), MP2 (at the CBS limit), and CCSD(T) (computed using the hybrid “gold-standard5” method with ΔCCSD(T)/aVDZ) interaction energies. The plot corresponds to the most stable phenol-indole dimer (obtained using QM optimization), but is representative of other dimer scans. The x-axis shows the k index, with k = 0 corresponding to the reference geometry (in this case, the most stable QM-optimized geometry, based on MP2, for the phenol-indole dimer) used to construct the radial scan. Each k unit corresponds to a 0.1 Å step along the intermolecular axis (defined in the “Generation of QM-based dimer geometries” section of the manuscript). These steps are, in general, taken in both the negative (more compact) and positive (more separated) directions with respect to the reference geometry (k = 0). All circles shown on the CCSD(T) curve correspond to data points included in the DES370K dataset. Red circles on the CCSD(T) curve correspond to data points included in the DES15K dataset. In the case of QM-derived dimer scans (as is the case here), we selected four conformers to include in DES15K: the conformer with the lowest energy, designated Emin; the conformer that was less compact than the lowest-energy conformer and had an energy nearest to Emin + 0.5Eexc, where the positive excitation energy is defined as Eexc = min(|Emin|, 10 kcal mol−1); the conformer representing the zero of the interaction energy curve (when |Emin| < 10 kcal mol−1), such that it was more compact than the lowest-energy conformer with an energy nearest to Emin + Eexc; and the conformer with an energy nearest to Emin + 3Eexc, which is representative of the repulsive region of the radial scan. Figure made with Grapher™ (Golden Software, LLC; http://www.goldensoftware.com).
