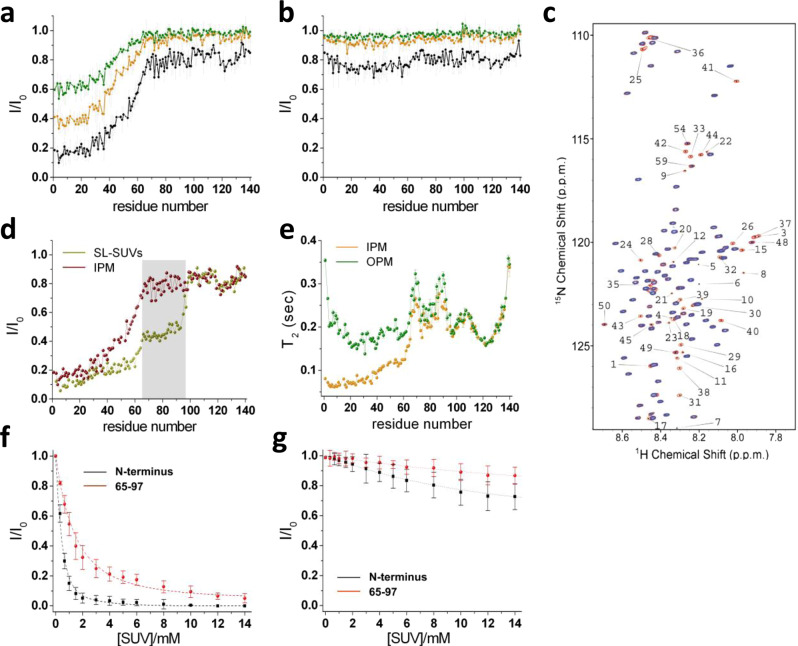
Fig. 1. αS binds IPM more strongly than OPM.
Interaction between αS and IPM (a) and OPM (b) monitored using NMR CEST. Spectra were aquired at 283 K in 20 mM of phosphate buffer at pH 6.0, at a 1H frequency of 700 MHz, using a protein and SUV IPM concentrations of 300 μM and 0.06% (0.6 mg/ml), respectively. NMR CEST profiles measured using a saturation bandwidth of 350 Hz (Fig. S2 for measurements performed with a bandwidth of 170 Hz) and probing the interaction between αS and IPM (a) or OPM (b). Black, orange and green lines refer to the averaged CEST profiles measured using offsets at ±1.5, ±3.0, and ±5.0 kHz, respectively. Error bars report the standard deviation estimated on the triplicate measurements. c Representative 1H-15N-HSQC CEST spectra of αS in the presence of IPM measured using a 350 Hz continuous wavelength at offsets of 100 kHz (red) and 1.5 kHz (blue). d Comparison of the interaction of αS with SL-SUVs43 (yellow) and IPM (red) probed with NMR CEST profiles measured using a saturation bandwidth of 350 Hz and offsets of ±1.5 kHz. Data for the SL-SUVs binding43 were measured at protein and lipid concentrations of 300 μM and 0.06% (0.6 mg/ml), respectively. Grey background highlights the significant difference in the saturation of the region spanning residues 65–97, resulting in populations of detached conformations for this region of 51% and 95% for SL-SUVs and IPM, respectively. e T2 values from transverse relaxation measurements (experimental conditions as in a, b). Green and orange report T2 values of αS in the presence of OPM and IPM, respectively. Error bars report the T2 fitting error. f–g Binding curves of αS to SUVs monitored via the signal attenuation of the peaks in the 1H-15N-HSQC spectra of αS (50 μM) as a function of the concentration of SUVs. The signal attenuations have been averaged across the residues of the N-terminal region (black) and the region spanning residues 65–97 (red) and error bars report the standard deviation of these values. In the case of IPM, the fitting provided KD values of 5.2 μM (L = 14.3) and 88.9 μM (L = 10.3) for the N-terminal (residues 1–25) and central (residues 65–97) region, respectively, whereas for OPM KD values resulted respectively 5933 μM (L = 5.7) and 13,689 μM (L = 6.1).

