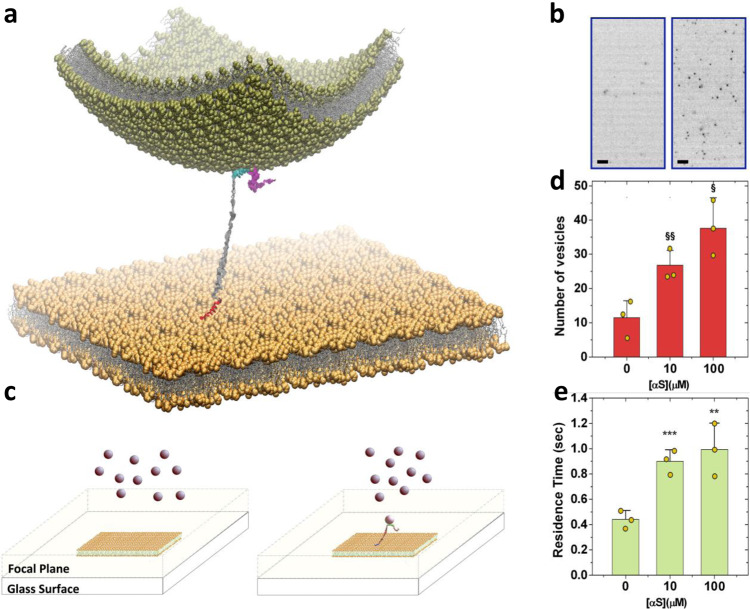
Fig. 2. αS mediates the docking of SVs to IPM.
a Illustration of the mechanism by which αS tethers the outer leaflet of a SV (green vesicle) to the inner leaflet of a synaptic membrane (flat yellow membrane). A double-anchor conformation of αS was modelled with the N-terminal region (red) bound to the IPM and the region of residues 65–97 (cyan) tethering the SV. Both anchors are modelled as amphipathic α-helices whereas the C-terminal region (residues 98–140, magenta) and the linker between the anchors (residues 26–64, grey) are in disordered conformations. b Example of TIRF images measured using 2 μM of fluorescently labelled SL-SUVs and IPM deposited onto the glass surface. Images obtained using 0 and 10 μM of αS are shown on the left and right, respectively (scale bar, 2 μm). These representative images are part of 7500 frames acquired at 40 ms of exposure time in TIRF videos. Three TIRF videos per sample condition were recorded and analyzed to quantify the number of docked vesicles and their residence time (d, e respectively). c Scheme of the TIRF imaging employed in this study. The focal plane extends up to 150 nm from the glass surface where the IPM are deposited (yellow membrane). SL-SUVs (pink spheres) float in the bulk solution and come into focus when docked onto the IPM surfaces. The schematic view shows measurements made in the absence (left) and presence (right) of αS and provide an example of how the double-anchor mechanism stabilises docked vesicles that are therefore imaged in the focal plane. d Statistical analysis of the number of docked vesicles on the IPM surface residing in the focal plane at different concentrations of αS and constant concentration of SUVs (2 μM). The symbols § and §§, indicate p values of 0.018 and 0.021, respectively, calculated with the unpaired t test using Welch’s correction. Error bars report the standard deviation estimated on the triplicate measurements. e Residence times of docked vesicles on the IPM surface at different concentrations of αS and constant concentration of SUVs (2 μM). The symbols ** and ***, indicate p values of 0.033 and 0.003, respectively, calculated with the unpaired t test using Welch’s correction. Error bars report the standard deviation estimated on the triplicate measurements.

