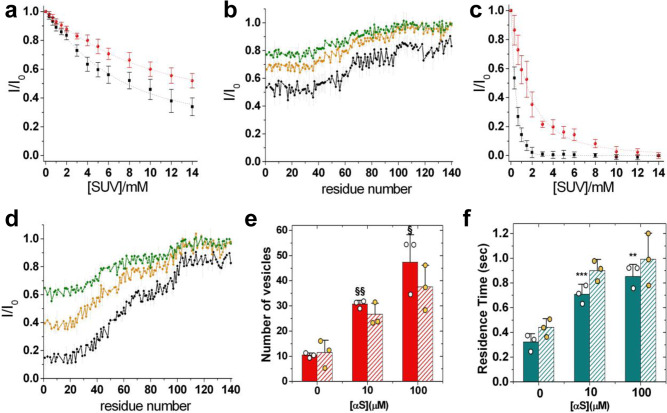
Fig. 3. Effect of GMs on the interaction of αS with IPM and OPM.
a Binding curves of αS to OPM-GMs SUVs monitored via the signal attenuation of the peaks in the 1H-15N-HSQC spectra of αS (50 μM) as a function of the concentration of SUVs. The signal attenuations have been averaged over the individual residues of the N-terminal region (black) and the region spanning residues 65–97 (red), and error bars report the standard deviation of these values. The resulting KD values are 424.5 μM (L = 17.5) and 3945 μM (L = 3.8) for the N-terminal region and the region spanning residues 65–97, respectively. b NMR CEST profiles along the sequence measured using a saturation bandwidth of 350 Hz (Fig. S5 for measurements performed with a bandwidth of 170 Hz) for the interaction between αS and OPM-GMs. Black, orange and green lines refer to the averaged CEST profiles measured using offsets at ±1.5, ±3.0, and ±5.0 kHz, respectively. Error bars report the standard deviation estimated on the triplicate measurements. C Interaction between αS and IPM-GMs (see (a) for details). The resulting binding affinities are 5.8 μM (L = 12.2) and 16.0 μM (L = 34.5) for the N terminus and the region 65–97, respectively. d NMR CEST analysis of the interaction between αS and IPM-GMs measured using a saturation bandwidth of 350 Hz (Fig. S5 for measurements performed with a bandwidth of 170 Hz). Details as in b. Error bars report the standard deviation estimated on the triplicate measurements. e Statistical analysis of the number of docked vesicles on IPM-GM surfaces (filled bars) imaged in the focal plane at different concentrations of αS and constant concentration of SUVs (2 μM). For comparison, data measured using IPM are reported with striped bars. The symbols § and §§, indicate p values of 0.028 and 0.0005, respectively, calculated with the unpaired t test using Welch’s correction. Error bars report the standard deviation estimated on the triplicate measurements. f Residence times of docked vesicles on the IPM-GM surfaces (filled bars) at different concentrations of αS and constant concentration of SUVs (2 μM). For comparison, data measured using IPM are reported with striped bars. The symbols ** and ***, indicate p values of 0.02 and 0.03, respectively, calculated with the unpaired t test using Welch’s correction. Error bars report the standard deviation estimated on the triplicate measurements.

