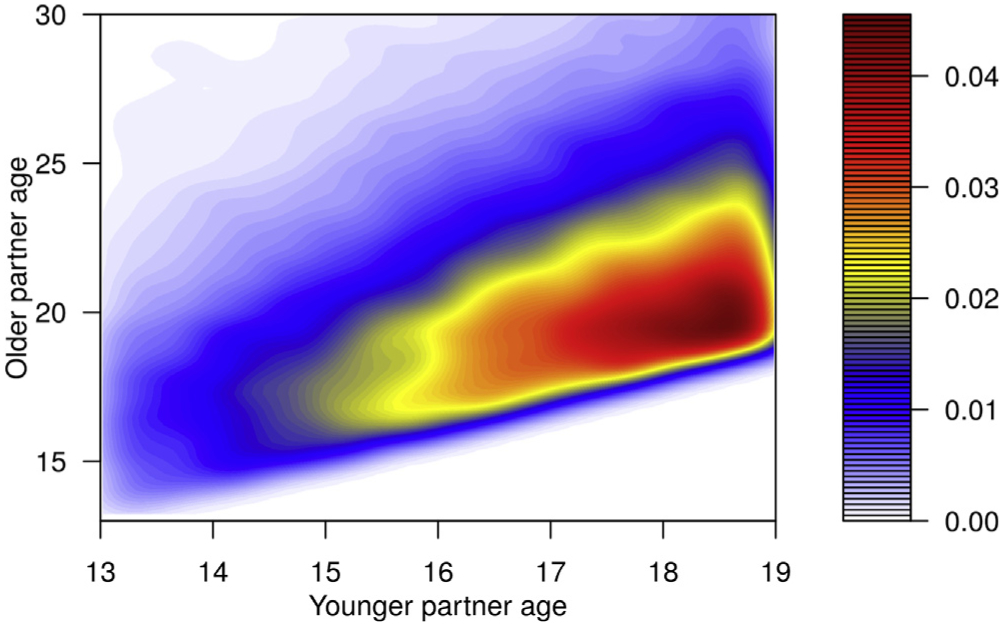
Figure 1.

Density heat map of partnerships involving adolescent sexual minority males by age. The density heat map shows the distribution of partnerships that include an adolescent sexual minority male based on the ages of the two individuals in the partnership. The age of the younger partner, who is always an adolescent sexual minority male, is shown on the x axis, and the age of the older partner, who could be another adolescent or an adult, is shown on the y axis. The density of partnerships at any age by age intersection on the map is indicated by the color with density increasing from white to red.
