
Fig. 5.
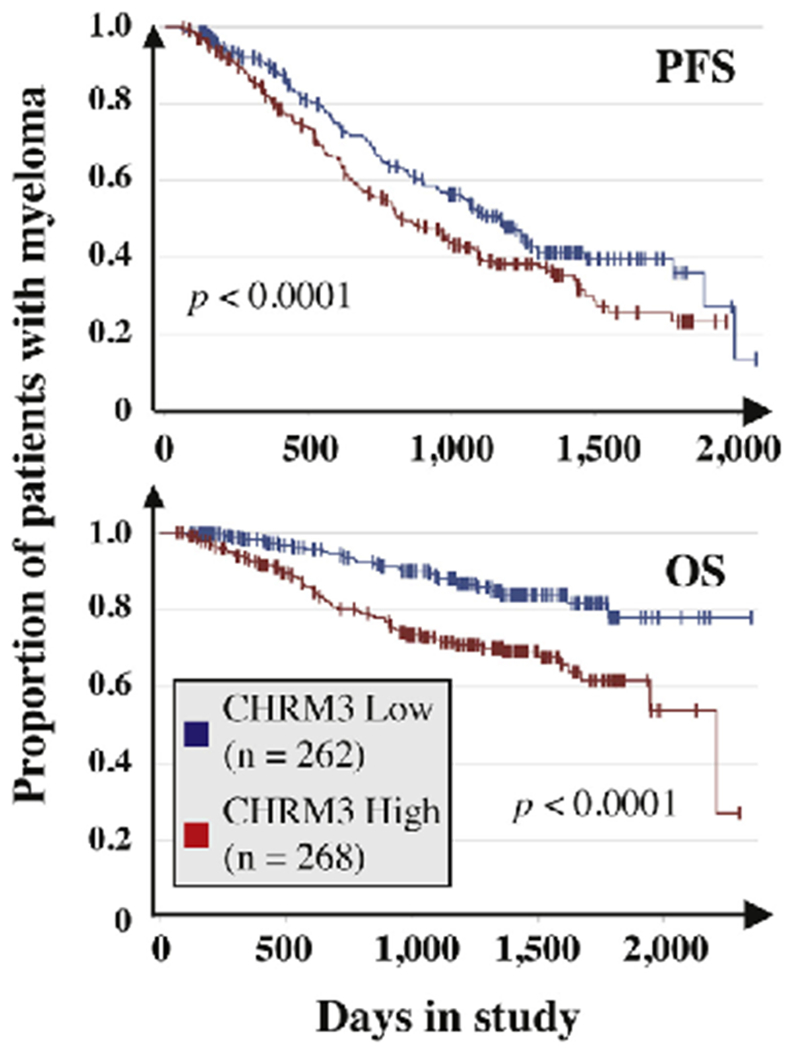
Elevated cholinergic receptor muscarinic 3 (CHRM3) mRNA level in myeloma cells predicts poor survival in the MMRF CoMMpass study. Kaplan-Meier curves of progression free survival (PFS) and overall survival (OS) are plotted. Censored patients are indicated by short vertical lines. Median gene expression was used as cutoff to allocate patients to the high expressor (red curve) or low expressor (blue curve) group. The number of patients in each group is shown. The results of log-rank analyses for differences in survival are also included. (For interpretation of the references to colour in this figure legend, the reader is referred to the web version of this article.)