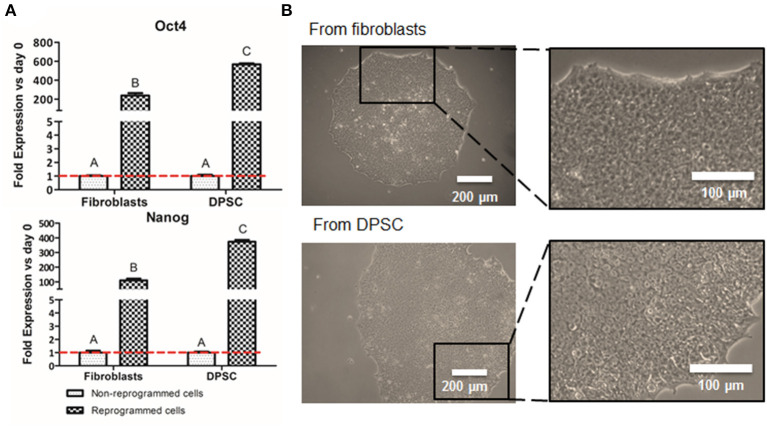
Figure 2.
Cell reprogramming from DPSC and fibroblasts. Relative mRNA expression in DPSC and fibroblasts (positive control), before and after cell reprogramming (A). Pluripotent expression of Oct 4 and Nanog by quantitative RT-PCR. Optical microscope images of iPSC colonies cultured in VTN-coated dishes from fibroblasts (positive control) and from DPSC (B). *Scale bars: 200 μm (lower magnification) and 100 μm (higher magnification). **Data presented are means ± SD, n = 3 technical replicates per donor and experimental group. Different letter denotes significant differences (p < 0.05). Same letter denotes non-significant differences.

