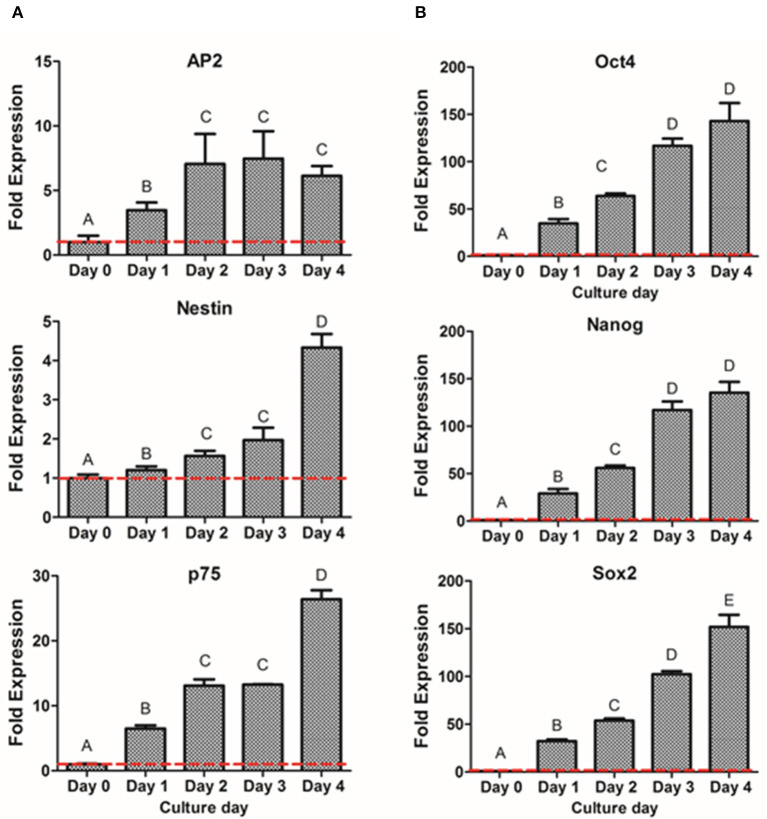
Figure 5.
Gene expression of NCSC formation from DPSC in suspension culture. Relative mRNA expression of NCSC markers AP2, Nestin, and p75 (A) and pluripotent markers Oct4, Nanog, and Sox2 (B) analyzed by quantitative RT-PCR. *Data presented are means ± SD, n = 3 technical replicates. Different letter denotes significant differences (p < 0.05). Same letter denotes non-significant differences.

