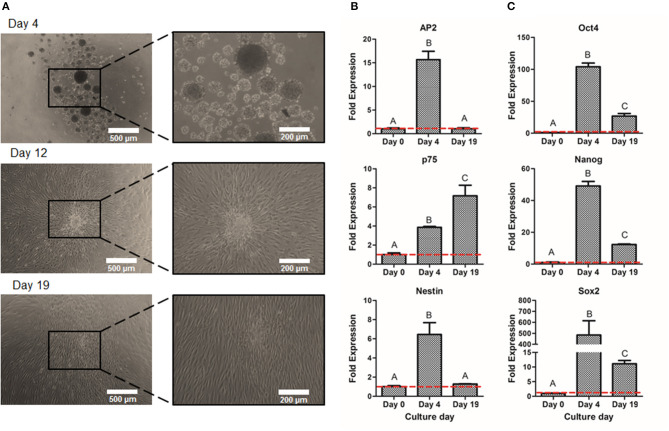
Figure 6.
Expansion of NCSC from DPSC. Microscope images of NCSC-derived from DPSC at days 4, 12, and 19 (A). Relative mRNA expression in NCSC-derived from DPSC, at days 0, 4, and 19 of NCSC markers AP2, Nestin, and p75 (B) and of pluripotent markers Oct4, Nanog, and Sox2 (C), by quantitative RT-PCR. *Scale bars: 500 μm (lower magnification) and 200 μm (higher magnification). **Data presented are means ± SD, n = 3 technical replicates. Significant differences compared to day 0 (p < 0.05).

