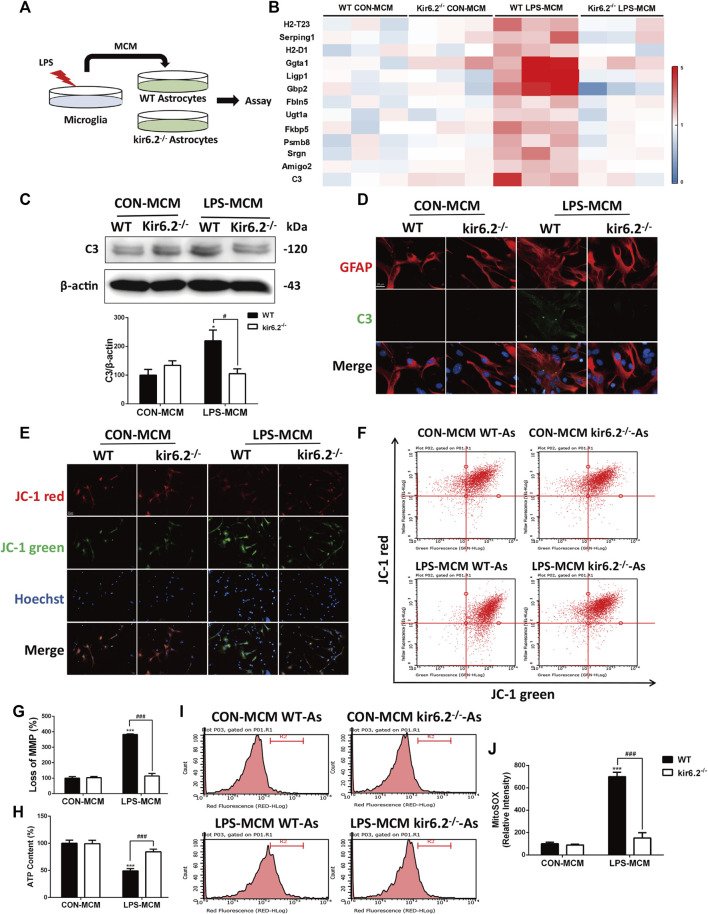
FIGURE 6.
Kir6.2-deficient astrocytes are resistant to neurotoxic A1-like phenotype in vitro. (A) Protocol of treatment for (B–J). Primary microglia from WT mice were stimulated with 100 ng/mL LPS for 24 h to collect the MCM. For primary astrocytes cultures, the MCM was diluted at a ratio of 1:3 to incubate the primary astrocytes from WT and kir6.2−/− mice for 24 h. (B) Heat map comparing the mean expression of A1-specific transcripts in astrocytic RNA samples by RT-PCR. (C) Expression of C3 in primary astrocytes detected by Western blotting and its densitometric analysis. (D) Immunofluorescent stainings of C3 (green) and GFAP (red) in primary astrocytes. (E) Representative images of JC-1 stain in astrocytes were observed by confocal microscopy. Hoechst stains nucleus (blue). (F) Flow cytometric analysis of astrocytes stained with JC-1 fluorescent probe. (G) Quantification of MMP loss in JC-1 staining measured by flow cytometry. (H) ATP contents of astrocytes were analyzed. (I) Astrocytes were stained with MitoSOX fluorescent probe and analyzed by flow cytometry. (J) Quantification of the mitochondrial ROS by MitoSOX staining. Data were analyzed using two-way ANOVA. *p < 0.05 and ***p < 0.001 vs. corresponding CON-MCM group. # p < 0.05 and ### p < 0.001 vs. WT LPS-MCM group. Values are presented as means ± SEM from three independent experiments.

