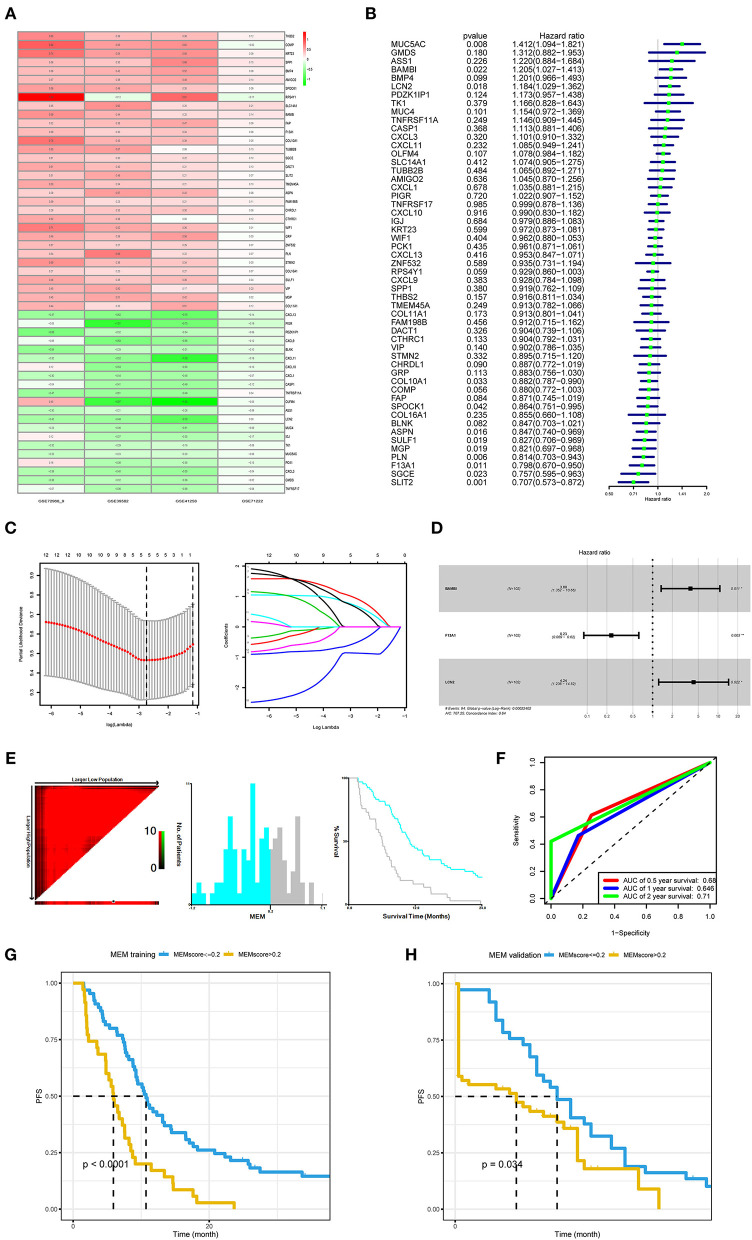
Figure 1.
Development and validation of the metastasis evaluation model (MEM). (A) American Joint Committee on Cancer (AJCC) M1 stage colorectal cancer samples and AJCC M0 stage colorectal cancer samples comprehensively compared to identify differentially expressed genes (DEGs) using robust rank aggregation (RobustRankAggreg) R package, and the thresholds were |log2-fold change (FC)| >1.0 and false discovery rate (FDR) <0.05. (B–D) Univariate Cox, least absolute shrinkage and selection operator (LASSO), and multivariate Cox regression analyses were employed to investigate the correlation between the patient's progression-free survival (PFS) and DEGs of M1 colorectal cancer. (E) The optimal cutoff value (−0.2) of the MEM level found using X-tile 3.6.1 software (Yale University, New Haven, CT, USA). (F) Time-dependent receiver operating characteristic curve (ROC) analysis conducted to evaluate the predictive power of the prediction model. (G) The Kaplan–Meier (K–M) survival curves for cases with a low or high metastasis risk in training cohort produced to show MEM's prediction ability (P < 0.0001). (H). The K–M survival curves for cases with a low- or high-metastasis risk in the MEM validation cohort approve MEM's prediction ability (P = 0.034).

