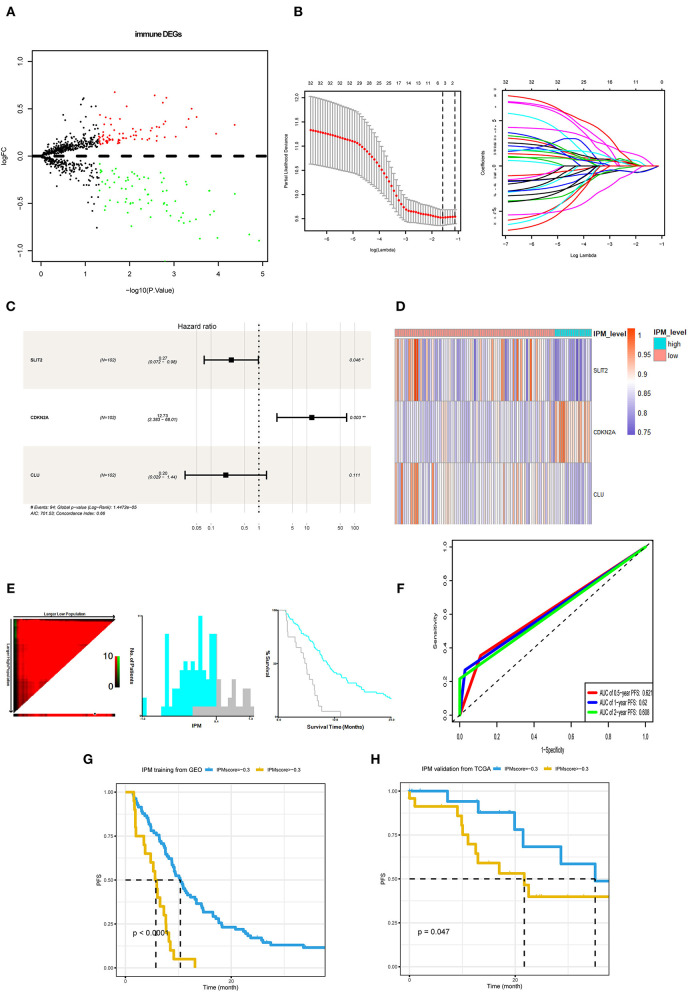
Figure 3.
Development and validation of immune prognostic model (IPM). (A) Immune-related genes in the immune biological process of gene set enrichment analysis (GSEA) results compared between metastasis evaluation model (MEM)-low and MEM-high risk clusters. (B,C) Least absolute shrinkage and selection operator (LASSO) and multivariate Cox regression analyses were employed to investigate the correlation between the patient progression-free survival (PFS) and immune-related differentially expressed genes (DEGs). (D) A heat map shows the expression of SLIT2, CDKN2A, and CLU in the IPM level. (E) The optimal cutoff value (0.4) of the IPM score found using X-tile 3.6.1 software (Yale University, New Haven, CT, USA). (F) Time-dependent receiver operating characteristic (ROC) curve analysis was conducted to evaluate the predictive power of the prediction model. (G) The K–M survival curves for cases with a low or high metastasis risk in training cohort produced to show IPM's prediction ability (P < 0.0001). (H) The K–M survival curves for cases with a low- or high-recurrence risk in the Cancer Genome Atlas (TCGA) validation cohort approve IPM's prediction ability (P = 0.047).

