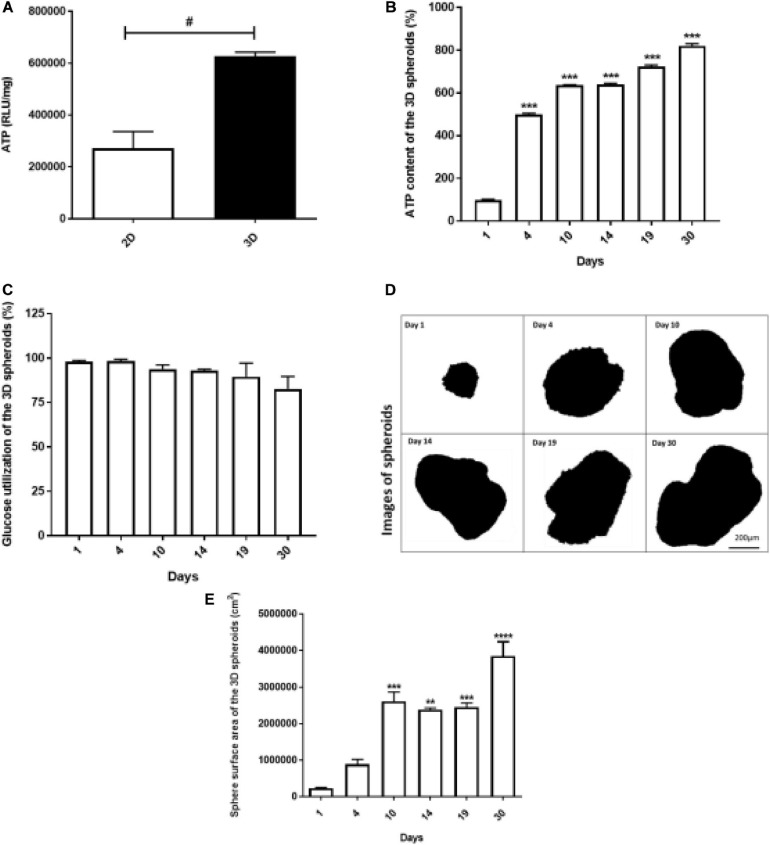
FIGURE 3.
Viability of 2D monolayers and 3D spheroids. The ATP luminescence was assessed in the 2D monolayers and 3D spheroids after 24 h and 1 day in culture, respectively. ATP/mg was higher in the 3D spheroids compared to 2D monolayers (A). In the 3D spheroids, ATP content increased from day 1 to 30 (B), while glucose utilization was comparable throughout (C). The sphere surface area of the spheroids increased from day 1 to 10 and stabilized from day 14 to 19, followed by a gradual increase up to day 30 (D,E). Scale bars: 200 μm (D). Data expressed as mean ± SEM, Student’s t-test and ANOVA was used to conduct analysis: #p < 0.05 2D vs. 3D condition (Two-way ANOVA); **p < 0.001 vs. day 1, ***p < 0.0001 vs. day 1 (Ordinary One-way ANOVA).

