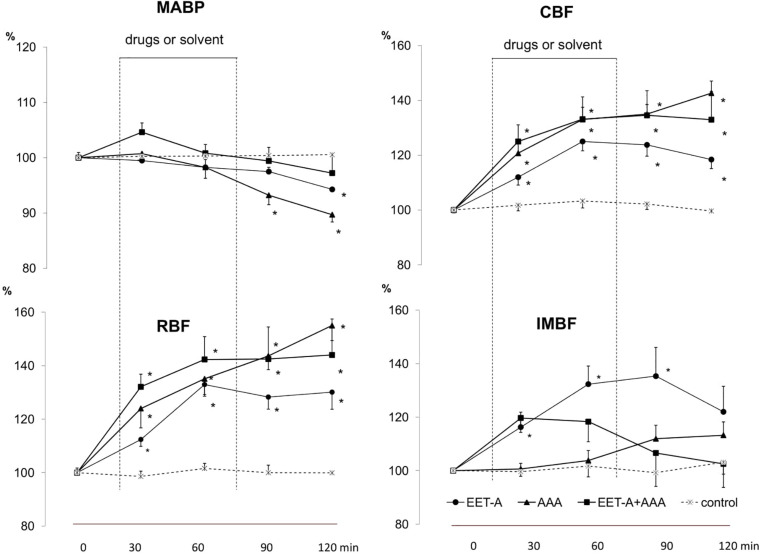
FIGURE 1.
Effects of treatments (EET-A, 5 mg/kg; AAA, 10 mg/kg; EET-A + AAA, 5 mg/kg +10 mg/kg) on mean arterial blood pressure (MABP), total renal blood flow (RBF), cortical blood flow (CBF), and inner medullary blood flow (IMBF). Denotations: EET-A, filled circles and continuous lines; AAA – filled triangles and continuous lines; EET-A + AAA, filled squares and continuous lines; control – crosses and dotted lines. n = 7 in each group. *Significantly different from control period at p < 0.05.

