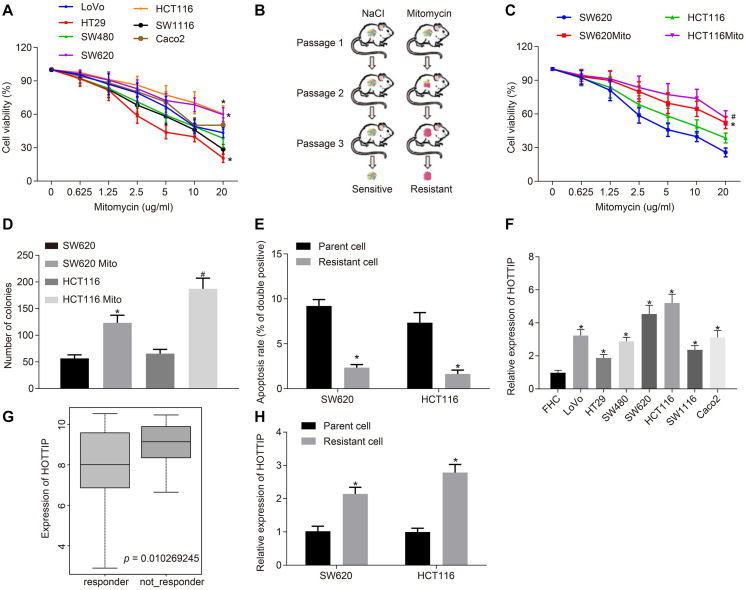
FIGURE 1.
HOTTIP is highly expressed in mitomycin-resistant CRC cells. (A) Viability of 7 CRC cell lines (LoVo, HT29, SW480, SW620, HCT116, SW1116, and Caco2) assayed using CCK-8 after 72 h of mitomycin treatment at the indicated concentrations. (B) Schematic diagram of the screen process of mitomycin-resistant CRC cells. (C) Viability of parental cells and mitomycin-resistant cells assayed using CCK-8 after 12 h of mitomycin treatment at the indicated concentrations. (D) Colony formation of parental and mitomycin-resistant cells. (E) Apoptosis rates of parental and mitomycin-resistant cells treated with mitomycin (5 μg/mL) for 24 h determined by flow cytometry. (F) RT-qPCR determination of HOTTIP expression in 7 CRC cell lines (LoVo, HT29, SW480, SW620, HCT116, SW1116, and Caco2) and normal FHC cells. (G) Expression of the HOTTIP in the non-responder and responder based on CRC gene dataset GSE68204. (H) RT-qPCR determination of HOTTIP expression in parental and mitomycin-resistant CRC cells. *p < 0.05 vs. the LoVo, SW620 cells, parental cells or FHC cells; #p < 0.05 vs. the HCT116 cells. Data (mean ± standard deviation) between two groups were analyzed by unpaired t test and those among multiple groups were compared using one-way ANOVA with Tukey’s post hoc test. Data between groups at different time points were compared using repeated measures ANOVA, followed by Bonferroni post hoc test. The cell experiments were independently conducted in triplicates. n = 5 in animal experiments.

