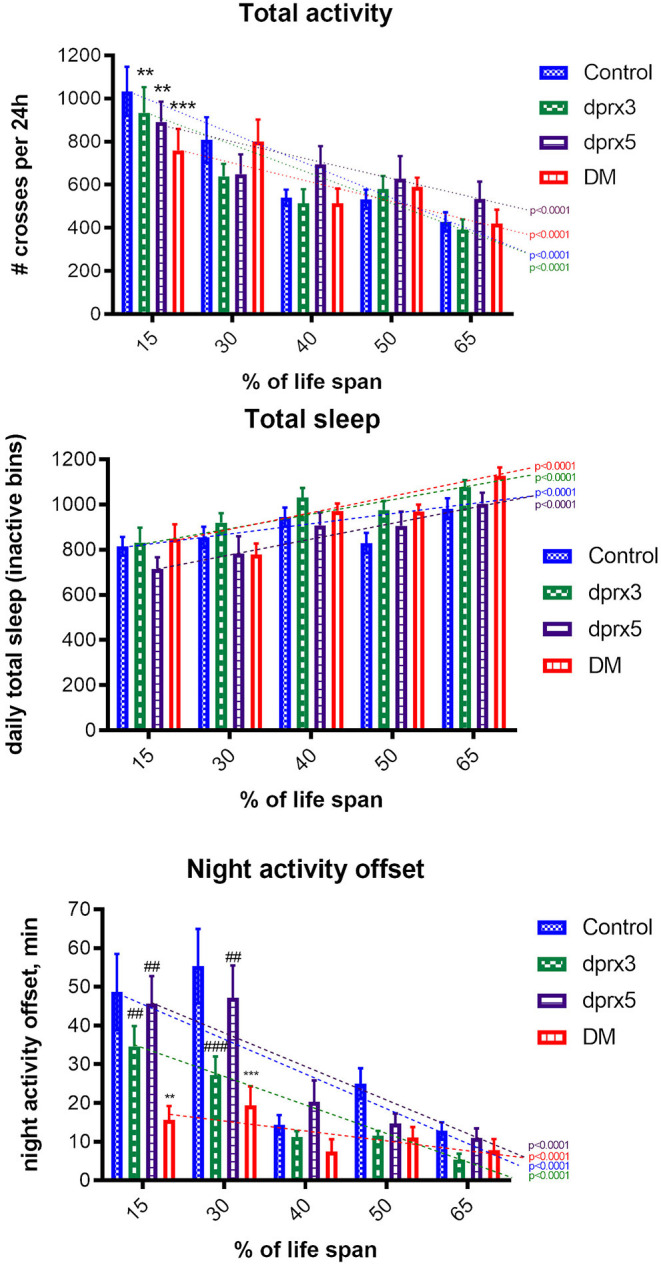
Figure 3.

Sleep-wake behavior of single fly. Analysis of daily total activity, daily total sleep and night activity offset in control (Control), single (prx3 and prx5) and Prx double mutants was undertaken in male flies at different physiological ages (Supplementary Table 2). All measurements were performed from Zeitgeber time 0 (ZT0) to ZT24. Results are means ± SEM (n = 14–16) for each time point of control and single mutants. The dotted lines represent trend lines of changes during aging, and P-values are shown for each fly line. There was a significant decrease in 24-h total activity during aging in all four fly lines (p < 0.0001). Statistical analysis has been done by two-way ANOVA with Bonferroni post-tests: Control vs. dprx3, Control vs. dprx5 at 15% life span (p < 0.01); Control vs. DM at 15% life span (p < 0.001). No statistically significant difference in the changes during aging was found between Control, the double and single mutant lines. The Bonferroni post-test showed a significant difference only between the mean values at 15% of life span. There was a gradual increase in 24-h total sleep during aging in all four lines resulting in statistically significant differences between flies at 15 and 65% of their life spans (p < 0.0001). There was no statistically significant difference in the changes during aging between Control, the double (DM) and single mutant lines. There was a significant decrease in night activity offset during aging in all four lines (p < 0.0001). Bonferroni post-tests: Control vs. dprx3 at 30% life span (p < 0.001); control vs. DM at 15% (p < 0.01) and 30% life span (p < 0.001), dprx3 vs. DM at 15% life span (p < 0.01), dprx5 vs. DM at 15 and 30% life span (p < 0.01). To compare the differences between different ages in control and mutant lines, we used two-way ANOVA analysis. To compare differences between means at each % of life span, we used Bonferroni post-tests, Prism software. *compare to control (*p < 0.05, **p < 0.01, ***p < 0.001); #compare to DM (#p < 0.05, ##p < 0.01, ###p < 0.001). P values marked by “*” indicate difference between mutants and control. P values marked by “#” indicate difference between single mutants and DM.
