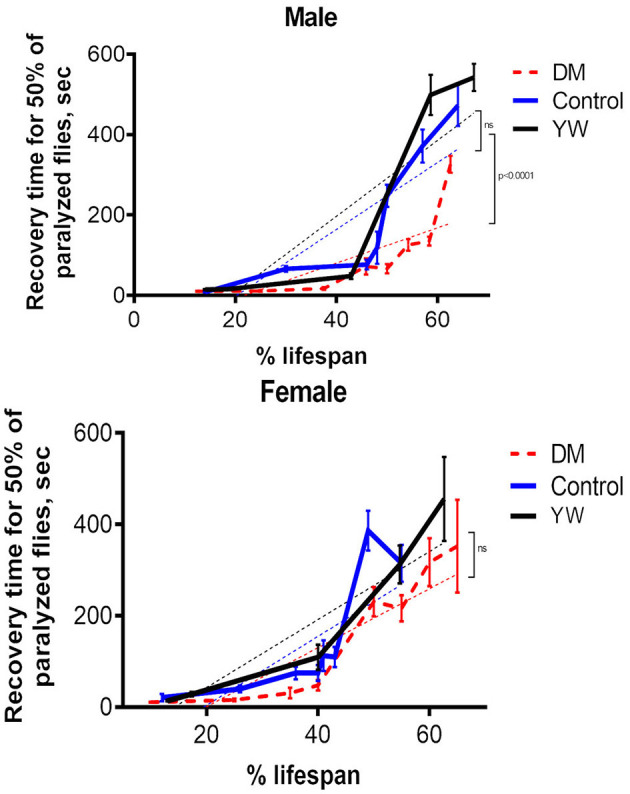
Figure 5.

Acquired temperature sensitive paralysis. Measurements were done in the DM, control (Da-GAL4, dprx5/+), and y w flies at different ages (Supplementary Table 4). Results are means ± SEM normalized to percent of life span. The dotted lines represent linear regression analysis curves. There were no statistically significant differences in age-specific changes in recovery time for 50% of paralyzed female flies between the DM and control lines, as determined by analysis of the slopes of corresponding regression lines. Statistically significant differences were observed between the DM and control male flies (P < 0.0001). There were no significant differences between driver control (+/Da-GAL4, dprx5) and y w control.
