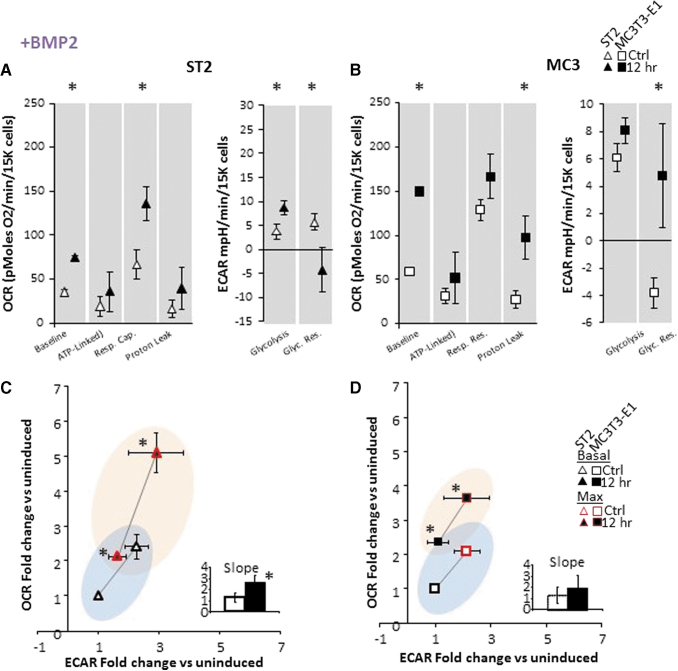
FIG. 3.
Bioenergetics in osteoprogenitor ST2 and MC3T3-E1 cell lines are acutely responsive to BMP2. (A) Specific metabolic contributions to OCR in ST2 cells were calculated as basal OCR (baseline minus AA/Rot), ATP production (baseline minus Oligo), respiratory capacity (FCCP minus baseline), and proton leak (Oligo minus AA/Rot). Specific metabolic contributions to ECAR were calculated as basal ECAR (baseline minus 2-DG) and glycolytic reserve (Oligo/FCCP minus baseline). (B) Specific metabolic contributions to OCR in MCT3T-E1 cells were calculated as in panel (A). (C, D) Energy map showing baseline (B: black outlined) and maximal (U: red outlined) OCR and ECAR following OBM addition as fold change over uninduced ST2 (C) or MC3T3-E1 (D) cells. The four quadrants represent cell metabolism attributable to “Quiescent” (lower left), “Aerobic” (upper left), “Energetic” (upper right), or “Glycolytic” (lower right) energy usage. Blue- and orange-colored ellipses represent the metabolic space covered by uninduced and induced cells, respectively. Inset shows the slope of each line generated from the xy-scatter plot. Slopes >1 indicate metabolic shifts toward aerobic respiration and slopes <1 indicated metabolic shifts toward glycolysis. Data are mean ± SD [n = 15 (three biologic replicates of five technical replicates)]. *P < 0.05 versus uninduced control as determined by ANOVA and confirmed by post hoc Bonferroni correction. Color images are available online.

