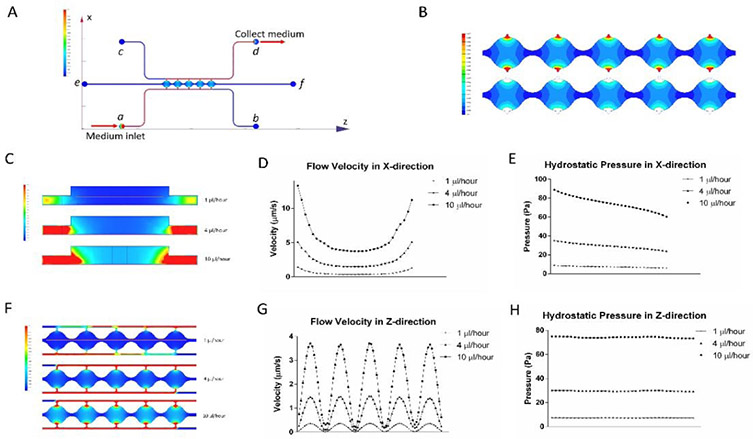
Figure 2. Simulation modeling results from the microfluidic device.
(A) Overview of flow direction and velocity distribution in both the side channels and central chambers using the syringe pump setup. (B) Colormap of the flow velocity distribution in cell culture chambers with 1 μl/hour medium input. (C) Flow velocities in the central chamber cross-section at different syringe pump volumetric flow rates. (D) Velocity in the X-direction in cell culture chambers. (E) Hydrostatic pressure in the X-direction. (F) Top view flow velocity in the five chambers at different syringe pump volumetric flow rates. (G) Velocity in the Z-direction in cell culture chambers. (H) Hydrostatic pressure in the Z-direction across the 5 cell culture chambers.

