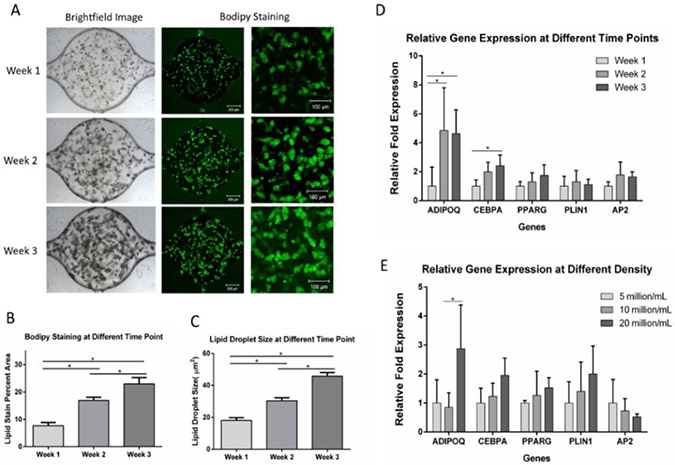
Figure 4. ADSCs differentiation within the microfluidic device.
(A) Brightfield and BODIPY staining images of cells at week 1 through week 3. (B) BODIPY staining quantification showed increased lipid loading through the course of 3 weeks. Values are means ± SD, n = 9 or 10. (C) Lipid droplet size at different time points during adipogenic differentiation. Values are means ± SD, n = 5. (D) Gene expression of adipocytes in microfluidic chambers at different time points. Values are means ± SD, n = 4 or 5. (E) Gene expression of adipocytes in microfluidic chambers with different densities. Values are means ± SD, n = 3 to 5. For all datasets, one-way ANOVA followed by Tukey’s multiple comparisons test was performed. *denotes significant difference (p < 0.05) between the marked groups.

