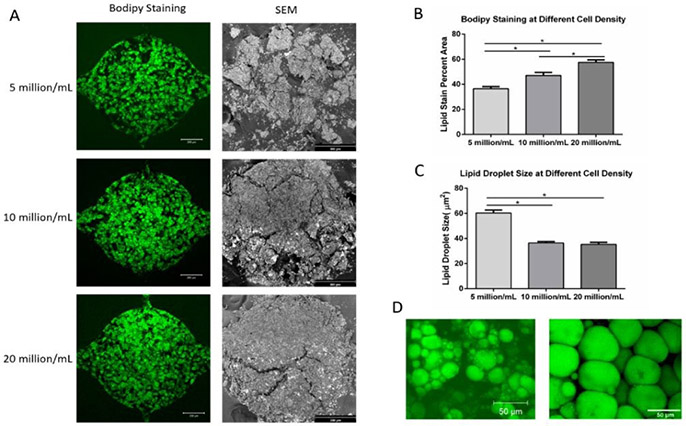
Figure 5. BODIPY staining and SEM imaging of adipose tissue in the microfluidic device.
(A) BODIPY staining (left column, scale bar: 200 μm) and SEM images (right column, scale bar: 300 μm) of adipose tissue formed in the microfluidic devices at 4 weeks under three different cell densities. (B) BODIPY stain percent area of adipose tissue under different cell densities. (C) Lipid droplet size at different cell densities. (D) Lipid content of the adipocytes in microfluidic device (left) and of native adipose tissue (right, modified from Aubin, K et al. 2015). For all datasets, values are means ± SD, n = 5. One-way ANOVA followed by Tukey’s multiple comparisons test was performed. *denotes significant difference (p < 0.05) between the marked groups.

