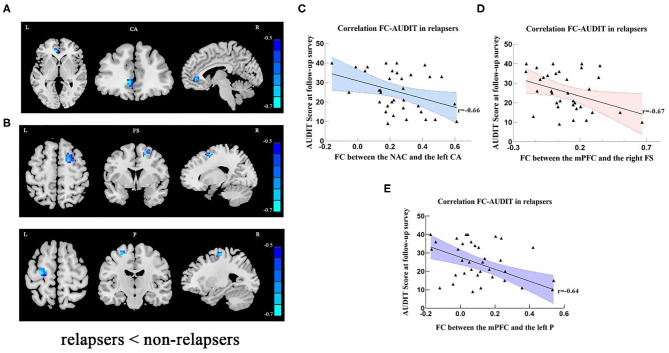
Figure 2.
(A) In relapse cases, lower FC was detected in left cingulate anterior cortex (seed: NAC). (B) In relapse cases, lower FC was detected in right frontal superior and left precentral areas (seed: mPFC). The scatter plots show that relapse severity was negatively associated with FC between NAc and left CA (C), FC between mPFC and right FS (D), and FC between the mPFC and left P (E). Clusters were labeled with the Automated Anatomical Labeling (AAL) atlas. The t maps were drawn with a threshold of p < 0.001 at the voxel level and PFWE < 0.05 at the cluster level. The color bar indicates voxel-wise t values. lower FC is shown in blue. The brighter the blue, the lower the FC. FC, functional connectivity; NAc, nucleus accumbens; mPFC, medial prefrontal cortex; L, left; R, right; CA, cingulum anterior; FS, frontal superior gyrus; P, precentral; AUDIT, alcohol use disorder identification test.

