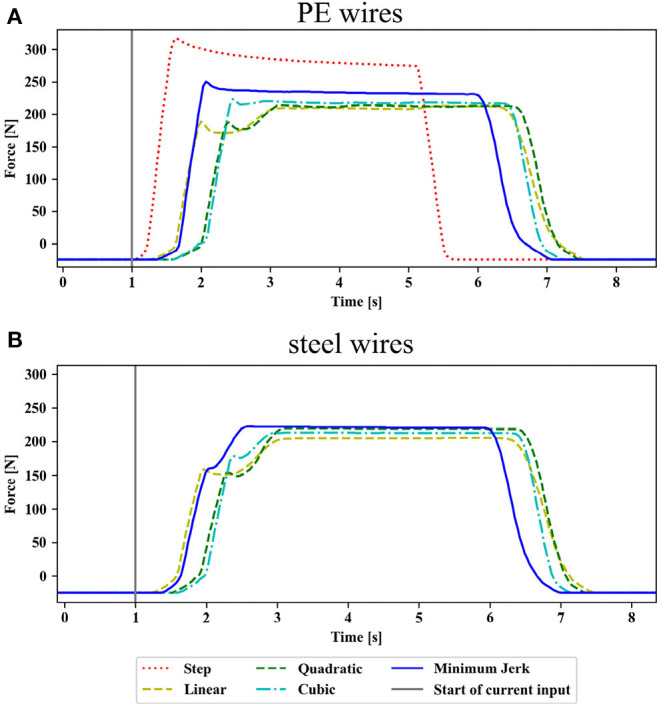
Figure 7.

Comparison of the output force profiles for different control inputs using (A) polyethylene (PE) wires and (B) steel wires for transmission: The output profiles are aligned with respect to the starting time of the input trajectory (vertical gray line). The final current for all input trajectories was 1.46 A. All input trajectories lead to an initial force peak, which was higher for the PE wires. The output force drops for the linear, quadratic, and cubic input after the initial peak before rising again. The steady-state is reached the fastest for the minimum jerk input without rising output force after the initial peak. For all control inputs, the final force level was lower for the steel wires compared to the PE wires. The output force for a step input on the steel wires is not shown as the wire tore at lower motor currents than 1.46 A.
