Figure 3.

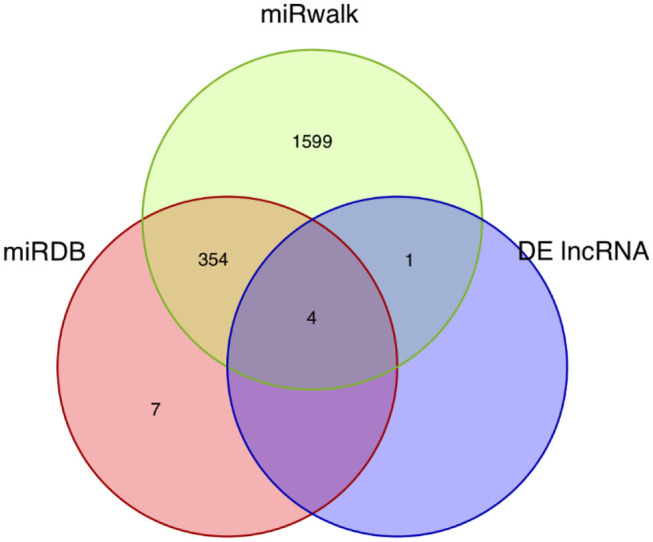
Venn diagram of the miRNA intersections. The Venn diagram shows the intersections of the miRNAs predicted by mRNAs and lncRNAs using the miRDB and miRWalk databases.

Venn diagram of the miRNA intersections. The Venn diagram shows the intersections of the miRNAs predicted by mRNAs and lncRNAs using the miRDB and miRWalk databases.