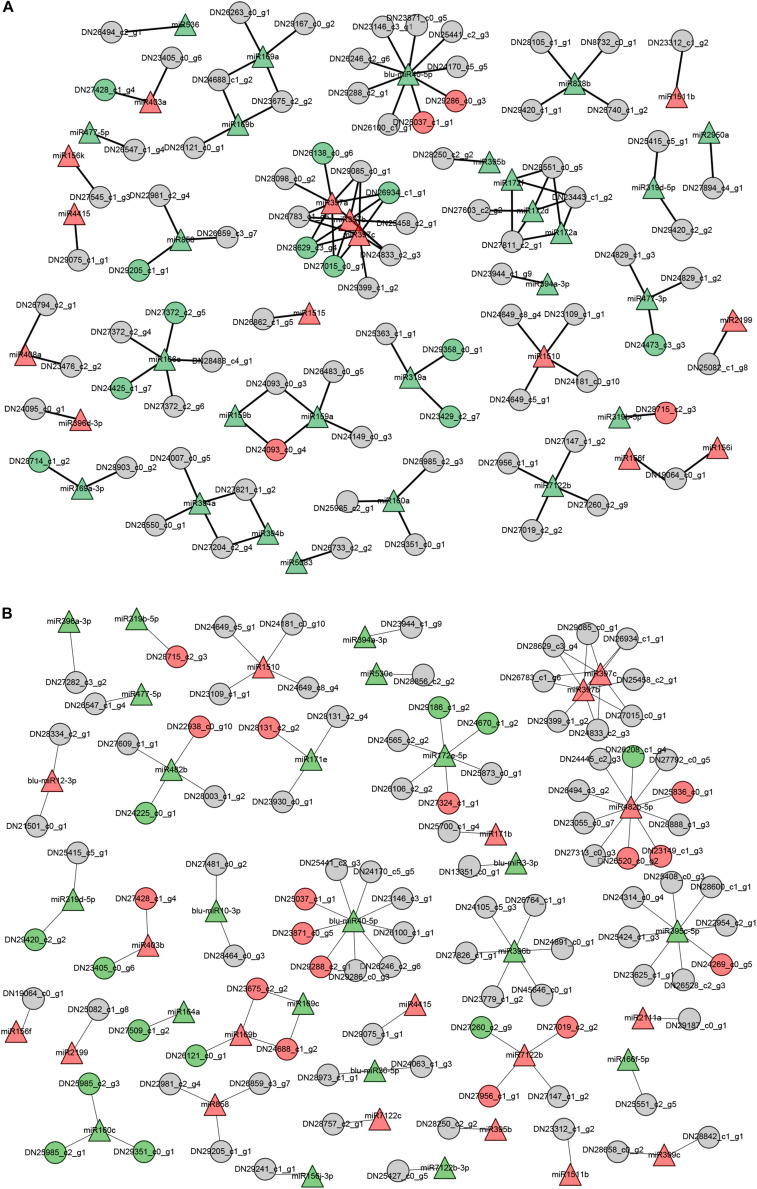
FIGURE 6.
The putative functional networks for –Pi-responsive miRNAs and their corresponding target genes in B. luminifera. The network depicts the relationship of –Pi-responsive miRNAs and target genes from their expression patterns upon Pi deficiency in shoots (A) and roots (B). Triangle indicates miRNAs and circles are target genes. Red represents upregulated, green indicates downregulated, and gray means unchanged under Pi starvation.

