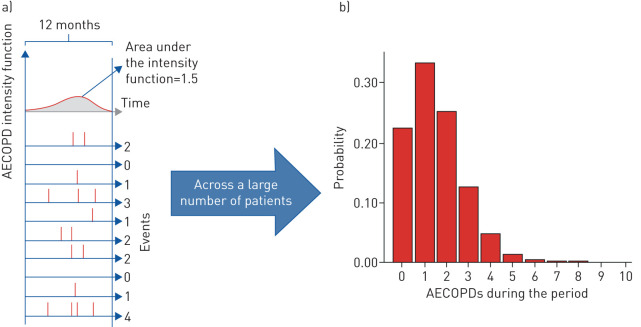
FIGURE 1.
An illustrative example of the randomness of the observed number of acute exacerbations of COPD (AECOPDs). Panels are as follows: (a, top) the unobserved intensity function and (a, bottom) randomly generated event histories for 10 individuals. Vertical lines indicate the occurence of an event and, notably, the same intensity function results in a random number of events; (b) the number of events during any single period, which follows a Poisson distribution. COPD: chronic obstructive pulmonary disease.

